Exam 16: Operational Performance Measurement: Further Analysis of Productivity and Sales
Exam 1: Cost Management and Strategy79 Questions
Exam 2: Implementing Strategy: The Value Chain, the Balanced Scorecard, and the Strategy Map70 Questions
Exam 3: Basic Cost Management Concepts98 Questions
Exam 4: Job Costing118 Questions
Exam 5: Activity-Based Costing and Customer Profitability Analysis149 Questions
Exam 6: Process Costing106 Questions
Exam 7: Cost Allocation: Departments, Joint Products, and By-Products96 Questions
Exam 8: Cost Estimation120 Questions
Exam 9: Short-Term Profit Planning: Cost-Volume-Profit CVP Analysis105 Questions
Exam 10: Strategy and the Master Budget146 Questions
Exam 11: Decision Making With a Strategic Emphasis137 Questions
Exam 12: Strategy and the Analysis of Capital Investments167 Questions
Exam 13: Cost Planning for the Product Life Cycle: Target Costing, Theory of Constraints, and Strategic Pricing94 Questions
Exam 14: Operational Performance Measurement: Sales, Direct-Cost Variances, and the Role of Nonfinancial Performance Measures178 Questions
Exam 15: Operational Performance Measurement: Indirect-Cost Variances and Resource-Capacity Management167 Questions
Exam 16: Operational Performance Measurement: Further Analysis of Productivity and Sales134 Questions
Exam 17: The Management and Control of Quality146 Questions
Exam 18: Strategic Performance Measurement: Cost Centers, Profit Centers, and the Balanced Scorecard130 Questions
Exam 19: Strategic Performance Measurement: Investment Centers and Transfer Pricing151 Questions
Exam 20: Management Compensation, Business Analysis, and Business Valuation108 Questions
Select questions type
Erwin Co.provided the following information for a selected production factor: Budgeted production 12,000 units Actual production 11,000 units Budgeted input 12,000 gallons Actual input 10,800 gallons The actual partial operational productivity ratio of the production factor is (round to two significant digits):
(Multiple Choice)
4.9/5  (44)
(44)
Broha Company manufactured 1,500 units of its only product during 2019. The inputs for this production are as follows:
450 pounds of Material A at a cost of $1.50 per pound
300 pounds of Material H at a cost of $2.75 per pound
300 direct labor hours at $20 per hour
The firm manufactured 1,800 units of the same product in 2018 with the following inputs:
500 pounds of Material A at a cost of $1.20 per pound
360 pounds of Material H at a cost of $2.50 per pound
400 direct labor hours at $18 per hour
Round all calculations to 2 significant digits.
The total productivity ratio in 2018 is:
(Multiple Choice)
4.8/5 (36)
Duo, Inc., carries two products and has the following year-end income statement (000s omitted): 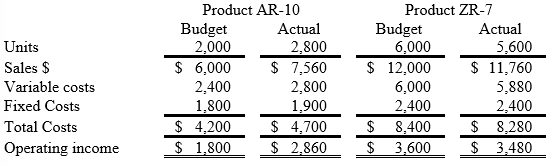 If products AR-10 and ZR-7 are substitutes for each other, a sales mix and sales volume variation for the combined products can be calculated. If this combination is calculated, the net effect on profit of the change in the unit sales mix is: (Round intermediate calculations to five significant digits, and your final answer to the nearest whole dollar amount.)
(Multiple Choice)
4.8/5 (32)
Gutsen Communications Inc. manufactures a scrambling device for cellular phones. The main component of the scrambling device is a very delicate part—DTV-12. DTV-12 requires careful handlings during manufacturing. Once damaged, the part must be discarded. Only skilled laborers are hired to manufacture and install DTV-12. Damages still occur, however. The following are the operating data of Gutsen Communications Inc. for 2018 and 2019 relative to the insertion of DTV-12. Round calculations to 2 significant digits. 2018 2019 Number of phones manufactured 600,000 780,000 Units of DTV-12 used 960,000 1,072,500 Direct labor hours for DTV-12 insertion 1,800 2,600 Total cost of DTV-12 units \ 1,443,750 \ 2,333,750 Direct labor wage rate per hour \6 7 \8 2 The partial financial productivity ratio of DTV-12 in 2018 is:
(Multiple Choice)
4.9/5 (34)
Creepers, Inc., manufactures stuffed spiders and mummies. During September the following information was gathered: Spiders Mummies Units sold 6,900 3,100 Budgeted sales (units) 7,500 2,500 Contribution margin per unit: Actual \ 3.75 \ 5.75 Budgeted \ 2.75 \ 5.25 What is the sales mix variance for Spiders?
(Multiple Choice)
4.8/5 (41)
Creepers, Inc., manufactures stuffed spiders and mummies. During September the following information was gathered: Spiders Mummies Units sold 6,900 3,100 Budgeted sales (units) 7,500 2,500 Contribution margin per unit: Actual \ 3.75 \ 5.75 Budgeted \ 2.75 \ 5.25 What is the sales volume variance for Spiders?
(Multiple Choice)
4.7/5 (41)
Hollaway Corp. has the following data for the current fiscal year: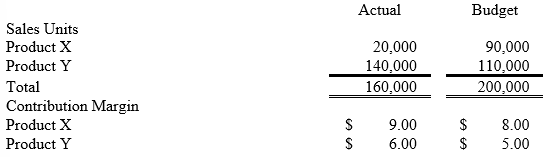 The total sales quantity variance for both products is:
(Multiple Choice)
4.9/5 (39)
Which one of the following is a result of the difference between the actual sales mix and the budgeted sales mix?
(Multiple Choice)
4.8/5 (35)
Wheat Inc. has an exclusive contract with an exporter. Two brands of wheat are imported, labeled AB and CD. The following data are provided for the current fiscal year: The total market was estimated to 40,000 bushels at the time of budget. The actual total market for the year is 32,000 bushels.
What is the firm's total sales quantity variance?
The total market was estimated to 40,000 bushels at the time of budget. The actual total market for the year is 32,000 bushels.
What is the firm's total sales quantity variance?
(Multiple Choice)
4.8/5 (35)
Winston Co. had two products code named X and Y. The firm had the following budget for August: Product X Product Y Total Sales \ 286,000 \ 520,000 \ 806,000 Variable Costs 189,800 218,400 408,200 Contribution Margin \ 96,200 \ 301,600 \ 397,800 Fixed costs 50,000 108,000 158,000 Operating Income \4 6,200 \1 93,600 \2 39,800 Selling Price per unit \1 10.00 \5 0.00
Product X Product Y Total Sales \ 360,000 \ 540,000 \ 900,000 Variable Costs 195,000 216,000 411,000 Contribution Margin \ 165,000 \ 324,000 \ 489,000 Fixed costs 50,000 108,000 158,000 Operating Income \1 15,00 \2 16,000 \3 31,000 Units Sold 3,000 9,000 Total industry volume for both products X and Y was estimated to be 130,000 units at the time of the budget. Actual industry volume for the period for products X and Y was 100,000 units.
The selling price variance for Product Y is:
(Multiple Choice)
4.8/5 (40)
(Budgeted contribution margin per unit) × (units sold − units budgeted to be sold) × (budgeted sales mix of the product) equals:
(Multiple Choice)
4.8/5 (32)
Folsom Fashions sells a line of women's dresses. The company uses flexible budgets to analyze its performances. The firm's performance report for November is presented below: 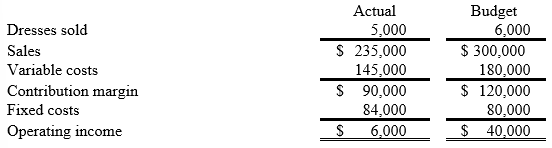 What additional information would be needed for Folsom to calculate the dollar impact of changes in market share on November's operating income?
(Multiple Choice)
4.9/5 (42)
Taylor, Inc., has the following information for the two most recent years of operations.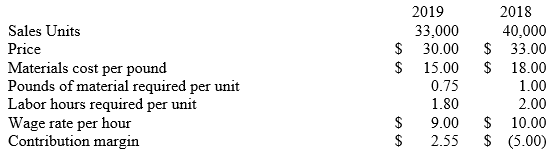 Required:
Determine the following:
1. Selling price variance in sales dollars.
2. Sales volume variance in contribution.
3. Materials usage variance.
4. Materials price variance.
5. Labor usage variance.
6. Labor rate variance.
Required:
Determine the following:
1. Selling price variance in sales dollars.
2. Sales volume variance in contribution.
3. Materials usage variance.
4. Materials price variance.
5. Labor usage variance.
6. Labor rate variance.
(Essay)
4.7/5 (28)
Decreasing selling prices in order to secure higher sales volumes or market shares:
(Multiple Choice)
4.9/5 (39)
Jackson, Inc., manufactures two products that it sells to the same market. Excerpted below are its budgeted and actual operating results for the year just completed: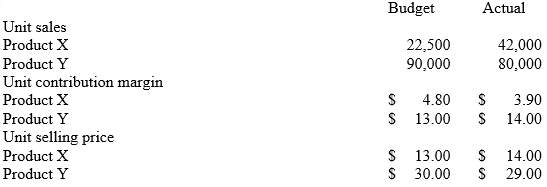 Industry volume was estimated to be 1,875,000 units at the time the budget was prepared. Actual industry volume for the period was 2,440,000 units. Jackson measures variances using contribution margin.
If fixed costs are budgeted for $500,000 and are actually $500,000, what is the difference between budgeted and actual operating income?
Industry volume was estimated to be 1,875,000 units at the time the budget was prepared. Actual industry volume for the period was 2,440,000 units. Jackson measures variances using contribution margin.
If fixed costs are budgeted for $500,000 and are actually $500,000, what is the difference between budgeted and actual operating income?
(Multiple Choice)
4.7/5 (30)
Winston Co. had two products code named X and Y. The firm had the following budget for August: Product X Product Y Total Sales \ 286,000 \ 520,000 \ 806,000 Variable Costs 189,800 218,400 408,200 Contribution Margin \ 96,200 \ 301,600 \ 397,800 Fixed costs 50,000 108,000 158,000 Operating Income \4 6,200 \1 93,600 \2 39,800 Selling Price per unit \1 10.00 \5 0.00
Product X Product Y Total Sales \ 360,000 \ 540,000 \ 900,000 Variable Costs 195,000 216,000 411,000 Contribution Margin \ 165,000 \ 324,000 \ 489,000 Fixed costs 50,000 108,000 158,000 Operating Income \1 15,00 \2 16,000 \3 31,000 Units Sold 3,000 9,000 Total industry volume for both products X and Y was estimated to be 130,000 units at the time of the budget. Actual industry volume for the period for products X and Y was 100,000 units.
The sales mix variance for Product Y is:
(Multiple Choice)
4.7/5 (47)
(Units sold − budgeted sales units) × (Budgeted contribution margin per unit) equals:
(Multiple Choice)
5.0/5 (53)
Filters
- Essay(0)
- Multiple Choice(0)
- Short Answer(0)
- True False(0)
- Matching(0)