Exam 14: Multiple Regression Analysis
Exam 1: What Is Statistics79 Questions
Exam 2: Describing Data: Frequency Tables, Frequency Distributions, and Graphic Presentation129 Questions
Exam 3: Describing Data: Numerical Measures132 Questions
Exam 4: Describing Data: Displaying and Exploring Data108 Questions
Exam 5: A Survey of Probability Concepts130 Questions
Exam 6: Discrete Probability Distributions128 Questions
Exam 7: Continuous Probability Distributions131 Questions
Exam 8: Sampling Methods and the Central Limit Theorem115 Questions
Exam 9: Estimation and Confidence Intervals129 Questions
Exam 10: One-Sample Tests of Hypothesis134 Questions
Exam 11: Two-Sample Tests of Hypothesis130 Questions
Exam 12: Analysis of Variance128 Questions
Exam 13: Correlation and Linear Regression130 Questions
Exam 14: Multiple Regression Analysis129 Questions
Exam 15: Index Numbers129 Questions
Exam 16: Time Series and Forecasting129 Questions
Exam 17: Nonparametric Methods: Goodness-Of-Fit Tests129 Questions
Exam 18: Nonparametric Methods: Analysis of Ranked Data129 Questions
Exam 19: Statistical Process Control and Quality Management129 Questions
Exam 20: An Introduction to Decision Theory115 Questions
Select questions type
To test the global hypothesis in multiple regression analysis, an F-statistic is used.
(True/False)
4.8/5  (25)
(25)
The following graph is used to evaluate two assumptions of a multiple regression analysis. What are the two assumptions? 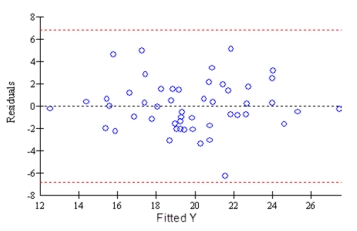
(Short Answer)
4.9/5 (41)
In multiple regression, a dummy variable is significantly related to the dependent variable when
(Multiple Choice)
4.8/5 (40)
The multiple coefficient of determination,  , reports the proportion of the variation in Y that is not explained by the variation in the set of independent variables.
(True/False)
4.9/5 (41)
In a multiple regression analysis, how many sources of variation are listed? Name the sources of variation. _____________
(Short Answer)
4.8/5 (38)
Twenty-one executives in a large corporation were randomly selected for a study to determine the effect of several factors on annual salary (expressed in $000's). The factors selected were age, seniority, years of college, number of company divisions they had been exposed to and the level of their responsibility. A regression analysis was performed using a popular spreadsheet program with the following regression output: 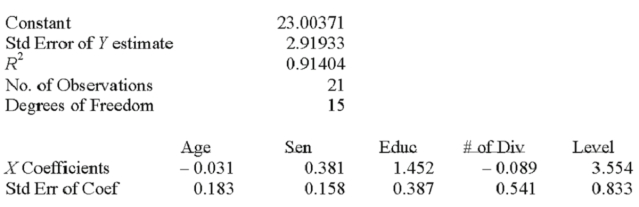
(Short Answer)
4.8/5 (33)
It has been hypothesized that overall academic success for college freshmen as measured by grade point average (GPA) is a function of IQ scores  , hours spent studying each week
  , and one's high school average
  . Suppose the regression equation is:
 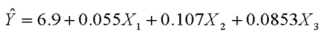 . The multiple standard error is 6.313 and R2 = 0.826.
What is the predicted GPA for a student with an IQ of 108, 32 hours spent studying per week and a high school average of 82?
. The multiple standard error is 6.313 and R2 = 0.826.
What is the predicted GPA for a student with an IQ of 108, 32 hours spent studying per week and a high school average of 82?
(Short Answer)
4.8/5 (44)
In a multiple regression analysis, if the regression coefficient of a dummy variable is significant and has a sample value of 100, then the dummy variable's effect on the dependent variable is an increase of 100.
(True/False)
4.8/5 (34)
For a global test of a multiple regression equation, the F-statistic is based on the regression and residual degrees of freedom.
(True/False)
4.9/5 (32)
Filters
- Essay(0)
- Multiple Choice(0)
- Short Answer(0)
- True False(0)
- Matching(0)