Exam 4: Describing Data: Displaying and Exploring Data
Exam 1: What Is Statistics79 Questions
Exam 2: Describing Data: Frequency Tables, Frequency Distributions, and Graphic Presentation129 Questions
Exam 3: Describing Data: Numerical Measures132 Questions
Exam 4: Describing Data: Displaying and Exploring Data108 Questions
Exam 5: A Survey of Probability Concepts130 Questions
Exam 6: Discrete Probability Distributions128 Questions
Exam 7: Continuous Probability Distributions131 Questions
Exam 8: Sampling Methods and the Central Limit Theorem115 Questions
Exam 9: Estimation and Confidence Intervals129 Questions
Exam 10: One-Sample Tests of Hypothesis134 Questions
Exam 11: Two-Sample Tests of Hypothesis130 Questions
Exam 12: Analysis of Variance128 Questions
Exam 13: Correlation and Linear Regression130 Questions
Exam 14: Multiple Regression Analysis129 Questions
Exam 15: Index Numbers129 Questions
Exam 16: Time Series and Forecasting129 Questions
Exam 17: Nonparametric Methods: Goodness-Of-Fit Tests129 Questions
Exam 18: Nonparametric Methods: Analysis of Ranked Data129 Questions
Exam 19: Statistical Process Control and Quality Management129 Questions
Exam 20: An Introduction to Decision Theory115 Questions
Select questions type
Quartiles divide a distribution into ten equal parts.
Free
(True/False)
4.7/5  (24)
(24)
Correct Answer: Verified
False
If a student places in the 99th percentile on an exam, she performed better than 99% of all students who completed the exam. Her performance is similar to a statement based on a
Free
(Multiple Choice)
4.8/5 (41)
Correct Answer:Verified
B
If a distribution is negatively skewed, the distribution is not symmetrical and the long tail is to the left.
Free
(True/False)
4.9/5 (34)
Correct Answer:Verified
True
In a stem-and-leaf display, the leaf represents the members of a class in a frequency distribution.
(True/False)
4.8/5 (30)
The coefficient of skewness is a measure of ____________ symmetry.
(Short Answer)
4.8/5 (35)
For the following data, what relationship is shown in the graph? 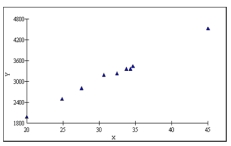
(Short Answer)
4.9/5 (35)
A relationship between two nominal variables is summarized by a contingency table.
(True/False)
4.9/5 (41)
In a symmetric distribution, is the 99th percentile located in the right or left tail? _______________
(Short Answer)
4.9/5 (38)
A telemarketing firm is monitoring the performance of its employees based on the number of sales per hour. One employee had the following sales for the last 20 hours. 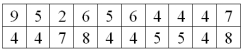 What is the first quartile for the distribution of number of sales per hour? ________________
(Short Answer)
4.7/5 (24)
Draw a negatively or positively skewed distribution and show the relative locations of the mean, median, and mode.
(Not Answered)
This question doesn't have any answer yet
A large oil company is studying the number of gallons of gasoline purchased per customer at self-service pumps. The mean number of gallons is 10.0 with a standard deviation of 3.0 gallons. The median is 10.75 gallons. What is the Pearson's coefficient of skewness?
(Multiple Choice)
4.8/5 (42)
What chart or graph uses several rows of data to show a frequency distribution? _______________
(Short Answer)
4.9/5 (40)
The test scores for a class of 147 students are computed. What is the location of the test score associated with the third quartile?
(Multiple Choice)
4.9/5 (33)
Filters
- Essay(0)
- Multiple Choice(0)
- Short Answer(0)
- True False(0)
- Matching(0)