Exam 16: Time Series and Forecasting
Exam 1: What Is Statistics79 Questions
Exam 2: Describing Data: Frequency Tables, Frequency Distributions, and Graphic Presentation129 Questions
Exam 3: Describing Data: Numerical Measures132 Questions
Exam 4: Describing Data: Displaying and Exploring Data108 Questions
Exam 5: A Survey of Probability Concepts130 Questions
Exam 6: Discrete Probability Distributions128 Questions
Exam 7: Continuous Probability Distributions131 Questions
Exam 8: Sampling Methods and the Central Limit Theorem115 Questions
Exam 9: Estimation and Confidence Intervals129 Questions
Exam 10: One-Sample Tests of Hypothesis134 Questions
Exam 11: Two-Sample Tests of Hypothesis130 Questions
Exam 12: Analysis of Variance128 Questions
Exam 13: Correlation and Linear Regression130 Questions
Exam 14: Multiple Regression Analysis129 Questions
Exam 15: Index Numbers129 Questions
Exam 16: Time Series and Forecasting129 Questions
Exam 17: Nonparametric Methods: Goodness-Of-Fit Tests129 Questions
Exam 18: Nonparametric Methods: Analysis of Ranked Data129 Questions
Exam 19: Statistical Process Control and Quality Management129 Questions
Exam 20: An Introduction to Decision Theory115 Questions
Select questions type
A plastics manufacturer performed a quarterly time series analysis for demands over the last five years (periods 1 through 20). The analysis resulted in the following trend equation and seasonal indexes:
Ŷ = 920.0 + 22.6t 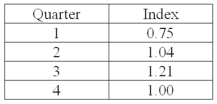 Ŷ
Based on the seasonal indexes, which quarter is expect to have 25% less demand than predicted by the trend line?
Ŷ
Based on the seasonal indexes, which quarter is expect to have 25% less demand than predicted by the trend line?
Free
(Short Answer)
4.9/5  (29)
(29)
Correct Answer: Verified
1
Product sales since 1999 are:  The least squares trend equation is given as
Ŷ = 265.12 - 21.18t, where t is set equal to one for 1999.
What were the predicted sales in 2006?
The least squares trend equation is given as
Ŷ = 265.12 - 21.18t, where t is set equal to one for 1999.
What were the predicted sales in 2006?
Free
(Short Answer)
4.8/5 (31)
Correct Answer:Verified
95.68
What is removed from a time series when the data is divided by the seasonal indexes? __
Free
(Short Answer)
4.8/5 (36)
Correct Answer:Verified
seasonality or seasonal fluctuations
When estimating the specific seasonals for a monthly time series, the sum of the 12 modified means should theoretically be equal to 1,200 because the average of the 12 specific seasonals is designated as 100.
(True/False)
4.9/5 (34)
Using the following time series data, 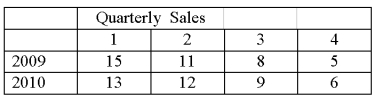 The quarterly indexes for the year 2010 will total approximately _______.
(Short Answer)
4.7/5 (36)
If the trend equation is Ŷ = 10 + 100t, the forecasted value increases 100 units for the next time period, t.
(True/False)
4.7/5 (24)
For the third quarter, the sales are 2,000 units; the seasonal index for the quarter is 0.80. What are the deseasonalized sales for the quarter?
(Multiple Choice)
4.9/5 (39)
What time series component was exemplified during the 1980's when the American economy enjoyed a period of prosperity?
(Multiple Choice)
4.8/5 (42)
In a time series, high sales in the summer and low sales in the winter is called?
(Multiple Choice)
4.8/5 (30)
The table below shows the sales for a resort hotel recorded over the past year. The seasonal indexes for each quarter are also provided. To track the trend for these four quarters, use the indexes to deseasonalize the sales data 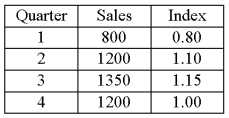 Overall, sales are:
(Short Answer)
4.8/5 (34)
Autocorrelation is measured by the trend component of a time series.
(True/False)
4.9/5 (31)
The forecast for the third quarter is 3,000 units; the seasonal index for the quarter is 1.05. What are the seasonally adjusted sales for the quarter?
(Multiple Choice)
4.9/5 (29)
A typical seasonal index of 103.7 for January indicates that sales for January are below the annual average.
(True/False)
4.9/5 (31)
The forecast for the third quarter is 3,000 units; the seasonal index for the quarter is 0.75. What are the seasonally adjusted sales for the quarter?
(Multiple Choice)
4.8/5 (30)
In the linear trend equation, the letter "b" is the average change in Ŷ for each change of one unit (either increase or decrease) in t.
(True/False)
4.8/5 (31)
The trend forecast equation is Ŷ = 120+ 100t. The next forecast is for period 11. The typical seasonal index for period 11 is 0.82. What are the forecast sales for period 11?
(Multiple Choice)
4.8/5 (31)
The table below shows the sales for a plastics manufacturer recorded over the past year. The seasonal indexes for each quarter are also provided. To track the trend for these four quarters, use the indexes to deseasonalize the sales data 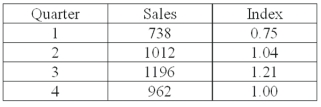 Overall, sales are:
(Short Answer)
4.8/5 (31)
Filters
- Essay(0)
- Multiple Choice(0)
- Short Answer(0)
- True False(0)
- Matching(0)