Exam 13: Correlation and Linear Regression
Exam 1: What Is Statistics79 Questions
Exam 2: Describing Data: Frequency Tables, Frequency Distributions, and Graphic Presentation129 Questions
Exam 3: Describing Data: Numerical Measures132 Questions
Exam 4: Describing Data: Displaying and Exploring Data108 Questions
Exam 5: A Survey of Probability Concepts130 Questions
Exam 6: Discrete Probability Distributions128 Questions
Exam 7: Continuous Probability Distributions131 Questions
Exam 8: Sampling Methods and the Central Limit Theorem115 Questions
Exam 9: Estimation and Confidence Intervals129 Questions
Exam 10: One-Sample Tests of Hypothesis134 Questions
Exam 11: Two-Sample Tests of Hypothesis130 Questions
Exam 12: Analysis of Variance128 Questions
Exam 13: Correlation and Linear Regression130 Questions
Exam 14: Multiple Regression Analysis129 Questions
Exam 15: Index Numbers129 Questions
Exam 16: Time Series and Forecasting129 Questions
Exam 17: Nonparametric Methods: Goodness-Of-Fit Tests129 Questions
Exam 18: Nonparametric Methods: Analysis of Ranked Data129 Questions
Exam 19: Statistical Process Control and Quality Management129 Questions
Exam 20: An Introduction to Decision Theory115 Questions
Select questions type
What is the proportion of explained variation called? ________________
(Short Answer)
4.8/5  (35)
(35)
In regression, the difference between the confidence interval and prediction interval formulas is
(Multiple Choice)
4.9/5 (38)
What is the direction of a regression line if its slope equals zero, indicating a lack of a relationship? ____________________
(Short Answer)
4.8/5 (40)
Using the following information: 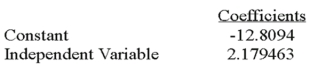
 The regression analysis can be summarized as follows:
(Multiple Choice)
4.8/5 (36)
If the correlation coefficient between two variables equals zero, what can be said of the variables X and Y?
(Multiple Choice)
4.8/5 (36)
What type of correlation designates an inverse relationship between two variables? ___________________
(Short Answer)
4.8/5 (38)
High school students were interested in a teacher's claim that the length of time (hours) that a student studies for a test, the higher the test score. The students collected the data and the teacher did the regression analysis with the following results. 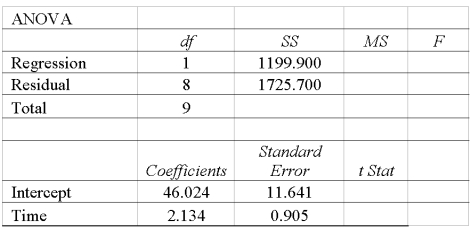 To test the null hypothesis that the slope is zero, what are the t-test statistic and the t-critical value using the 0.05 significance level?
(Short Answer)
4.8/5 (28)
What is the range of values for a coefficient of correlation?
(Multiple Choice)
4.8/5 (40)
The regression equation is Ŷ = 29.29 - 0.96X, the sample size is 8, and the standard error of the slope is 0.22. What is the test statistic to test the significance of the slope?
(Multiple Choice)
4.9/5 (40)
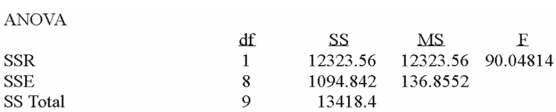
A company wants to study the effect of an employee's length of employment on their number of workdays absent. The results of the regression analysis follow.  What is the Y intercept of the linear equation? ______________
(Short Answer)
4.9/5 (36)
A sales manager for an advertising agency believes that there is a relationship between the number of contacts that a sales person makes and the amount of the sales dollars earned. A regression ANOVA shows the following results: 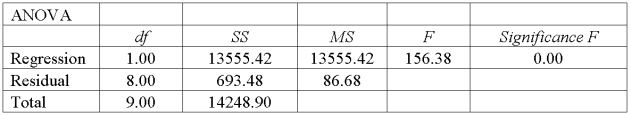 What is the value of the coefficient of determination?
(Multiple Choice)
4.8/5 (37)
An assumption of linear regression states that for each value of X, there is a group of Y values that are statistically __________________ and normally distributed about the regression line.
(Short Answer)
4.9/5 (30)
What is the general form of the regression equation? _____________
(Short Answer)
4.9/5 (38)
Given the least squares regression equation, Ŷ = 1,202 + 1,133X, when X = 3, what does Ŷ equal?
(Multiple Choice)
4.9/5 (32)
Using the following regression analysis.  What is the residual sum of squares?
(Short Answer)
4.9/5 (33)
A sales manager for an advertising agency believes that there is a relationship between the number of contacts that a sales person makes and the amount of the sales dollars earned. A regression ANOVA shows the following results: 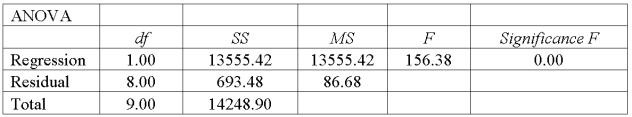 What is the value of the coefficient of correlation?
(Multiple Choice)
4.8/5 (30)
The coefficient of determination is the square root of the coefficient of correlation.
(True/False)
4.8/5 (41)
When comparing the 95% confidence and prediction intervals for a given regression analysis,
(Multiple Choice)
4.8/5 (44)
If the correlation between two variables is close to one, the association is
(Multiple Choice)
4.7/5 (30)
Filters
- Essay(0)
- Multiple Choice(0)
- Short Answer(0)
- True False(0)
- Matching(0)