Exam 11: Two-Sample Tests of Hypothesis
Exam 1: What Is Statistics59 Questions
Exam 2: Describing Data: Frequency Tables, Frequency Distributions, and Graphic Presentation78 Questions
Exam 3: Describing Data: Numerical Measures71 Questions
Exam 4: Describing Data: Displaying and Exploring Data64 Questions
Exam 5: A Survey of Probability Concepts79 Questions
Exam 6: Discrete Probability Distributions79 Questions
Exam 7: Continuous Probability Distributions82 Questions
Exam 8: Sampling Methods and the Central Limit Theorem71 Questions
Exam 9: Estimation and Confidence Intervals77 Questions
Exam 10: One-Sample Tests of Hypothesis69 Questions
Exam 11: Two-Sample Tests of Hypothesis62 Questions
Exam 12: Analysis of Variance80 Questions
Exam 13: Correlation and Linear Regression84 Questions
Exam 14: Multiple Regression Analysis81 Questions
Exam 15: Nonparametric Methods: Nominal Level Hypothesis Tests107 Questions
Exam 16: Nonparametric Methods: Analysis of Ordinal Data84 Questions
Exam 17: Index Numbers64 Questions
Exam 18: Time Series and Forecasting85 Questions
Exam 19: Statistical Process Control and Quality Management82 Questions
Exam 20: An Introduction to Decision Theory67 Questions
Select questions type
A recent study focused on the amount of money single men and women save monthly. The information is summarized here. Assume that the population standard deviations are equal.  At the 0.01 significance level,do women save more money than men? What is the value of the test statistic for this hypothesis test?
(Multiple Choice)
4.8/5  (26)
(26)
A recent study focused on the number of times men and women send a Twitter message in a day. The information is summarized here.  At the 0.01 significance level,we ask if there is a difference in the mean number of times men and women send a Twitter message in a day. What is the p-value for this hypothesis test?
(Multiple Choice)
4.9/5 (36)
A recent study focused on the amount of money single men and women save monthly. The information is summarized here. Assume that the population standard deviations are equal.  At the 0.01 significance level,do women save more money than men? What is the test statistic for this hypothesis?
(Multiple Choice)
4.9/5 (36)
If the null hypothesis states that there is no difference between the mean net income of retail stores in Chicago and New York City,then the test is two-tailed.
(True/False)
4.8/5 (29)
An investigation of the effectiveness of a training program to improve customer relationships included a pre-training and a post-training customer survey. To compare the differences they computed post-training survey score − pre-training survey score. Seven customers were randomly selected and completed both surveys. The results are shown here. 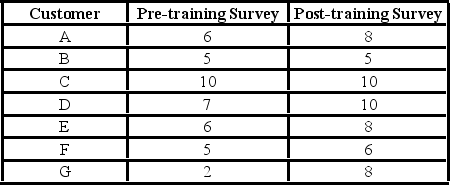 What is the value of the test statistic?
(Multiple Choice)
4.9/5 (32)
If the null hypothesis that two means are equal is true,where will 97% of the computed z-values lie between?
(Multiple Choice)
4.9/5 (35)
If we are testing for the difference between two population means and assume that the two populations have equal but unknown standard deviations,the sample standard deviations are pooled to compute the best estimated variance.
(True/False)
4.8/5 (34)
The following table shows sample salary information for employees with bachelor's and associate's degrees for a large company in the Southeast United States. 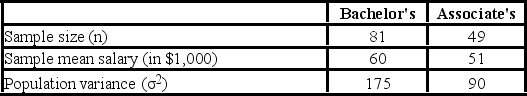 The point estimate of the difference between the means of the two populations is ________.
(Multiple Choice)
4.8/5 (28)
Which condition must be met to conduct a test for the difference in two sample means using a z-statistic?
(Multiple Choice)
4.8/5 (30)
The net weights (in grams)of a sample of bottles filled by a machine manufactured by Edne,and the net weights of a sample filled by a similar machine manufactured by Orno,Inc.,are shown here.  Testing the claim at the 0.05 level that the mean weight of the bottles filled by the Orno machine is greater than the mean weight of the bottles filled by the Edne machine,what is the critical value? Assume equal standard deviations for both samples.
(Multiple Choice)
4.9/5 (32)
A national manufacturer of ball bearings is experimenting with two different processes for producing precision ball bearings. It is important that the diameters be as close as possible to an industry standard. The output from each process is sampled,and the average error from the industry standard is measured in millimeters. The results are presented here. 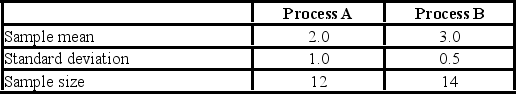 The researcher is interested in determining whether there is evidence that the two processes yield different average errors. The population standard deviations are unknown but are assumed equal. What is the null hypothesis?
(Multiple Choice)
4.8/5 (31)
A recent study focused on the number of times men and women send a Twitter message in a day. The information is summarized here.  At the 0.01 significance level,we ask if there is a difference in the mean number of times men and women send a Twitter message in a day. What is the value of the test statistic for this hypothesis test?
(Multiple Choice)
4.8/5 (45)
A recent study focused on the number of times men and women send a Twitter message in a day. The information is summarized here.  At the 0.01 significance level,is there a difference in the mean number of times men and women send a Twitter message in a day? Based on the p-value,what is your conclusion?
(Multiple Choice)
4.8/5 (31)
Accounting procedures allow a business to evaluate its inventory costs based on two methods: LIFO (last in first out)or FIFO (first in first out). A manufacturer evaluated its finished goods inventory (in $000s)for five products with the LIFO and FIFO methods. To analyze the difference,they computed FIFO − LIFO for each product. Based on the following results,does the LIFO method result in a lower cost of inventory than the FIFO method?  This example is what type of test?
(Multiple Choice)
4.8/5 (31)
Accounting procedures allow a business to evaluate its inventory costs based on two methods: LIFO (last in first out)or FIFO (first in first out). A manufacturer evaluated its finished goods inventory (in $000s)for five products with the LIFO and FIFO methods. To analyze the difference,they computed FIFO − LIFO for each product. We would like to determine if the LIFO method results in a lower cost of inventory than the FIFO method.  What is the value of calculated t?
(Multiple Choice)
4.9/5 (27)
Consider independent simple random samples that are taken to test the difference between the means of two populations. The variances of the populations are unknown but are assumed to be equal. The sample sizes of each population are n1 = 37 and n2 = 45. The appropriate distribution to use is the ________.
(Multiple Choice)
4.7/5 (41)
Accounting procedures allow a business to evaluate their inventory costs based on two methods: LIFO (last in first out)or FIFO (first in first out). A manufacturer evaluated its finished goods inventory (in $000s)for five products with the LIFO and FIFO methods. To analyze the difference,they computed FIFO − LIFO for each product. We would like to determine if the LIFO method results in a lower cost of inventory than the FIFO method.  What are the degrees of freedom?
(Multiple Choice)
4.9/5 (24)
When is it appropriate to use the paired difference t-test?
(Multiple Choice)
4.8/5 (32)
Twenty randomly selected statistics students were given 15 multiple choice questions and 15 open-ended questions,all on the same material. The professor was interested in determining if students scored higher on the multiple choice questions. This experiment is an example of ________.
(Multiple Choice)
4.7/5 (26)
Two samples,one of size 14 and the second of size 13,are selected to test the difference between two population means. How many degrees of freedom are used to find the critical value? Assume the population standard deviations are equal.
(Multiple Choice)
4.8/5 (32)
Filters
- Essay(0)
- Multiple Choice(0)
- Short Answer(0)
- True False(0)
- Matching(0)