Exam 3: Describing Data Visually
Exam 1: Overview of Statistics52 Questions
Exam 2: Data Collection111 Questions
Exam 3: Describing Data Visually108 Questions
Exam 4: Descriptive Statistics150 Questions
Exam 5: Probability123 Questions
Exam 6: Discrete Probability Distributions126 Questions
Exam 7: Continuous Probability Distributions120 Questions
Exam 8: Sampling Distributions and Estimation106 Questions
Exam 9: One-Sample Hypothesis Tests147 Questions
Exam 10: Two-Sample Hypothesis Tests113 Questions
Exam 11: Analysis of Variance126 Questions
Exam 12: Simple Regression135 Questions
Exam 13: Multiple Regression130 Questions
Exam 14: Time Series Analysis114 Questions
Exam 15: Chi-Square Tests99 Questions
Exam 16: Nonparametric Tests85 Questions
Exam 17: Quality Management108 Questions
Select questions type
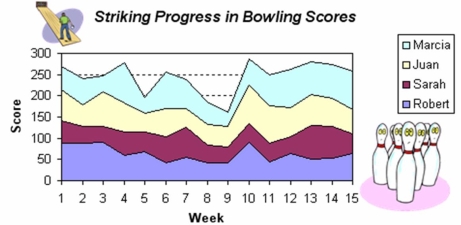
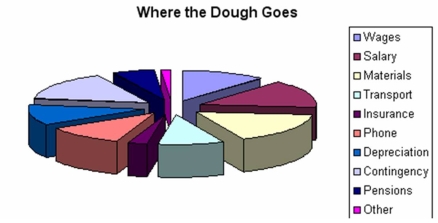
Briefly list strengths and weaknesses of this display. Cite specific principles of good graphs, as well as offering your own general interpretation.
(Essay)
4.9/5  (39)
(39)
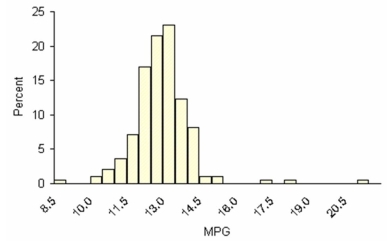
Craig operates a part-time snow-plowing business using a 2002 GMC 2500 HD extended cab short box truck. Describe Craig's gasoline mileage based on this histogram of 195 tanks of gas.
(Essay)
4.8/5 (38)
A population has 75 observations. One class interval has a frequency of 15 observations. The relative frequency in this category is:
(Multiple Choice)
4.8/5 (35)
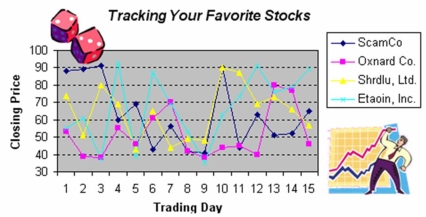
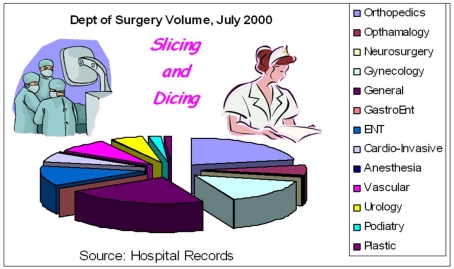
Briefly list strengths and weaknesses of this display. Cite specific principles of good graphs, as well as offering your own general interpretation.
(Essay)
4.8/5 (37)
A frequency distribution is a tabulation of n data values into classes called bins.
(True/False)
4.8/5 (34)
This histogram shows Chris's golf scores in his last 77 rounds at Devil's Ridge. Which is not a correct statement? 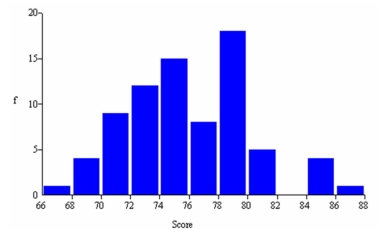
(Multiple Choice)
4.7/5 (44)
To classify prices from 62 recent home sales, Sturges' Rule would recommend:
(Multiple Choice)
4.8/5 (31)
Below is a sorted stem-and-leaf diagram for the measured speeds (miles per hour) of 49 randomly chosen vehicles on highway I-80 in Nebraska. What is the fourth slowest speed in the sorted data array? stem unit
leaf unit
Frequency Stem Leaf 1 4 9 1 5 5 17 6 01222455556688999 19 7 0111233345666778999 7 8 0133557 4 9 0122 49
(Multiple Choice)
4.7/5 (42)
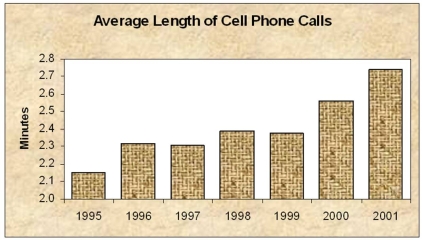
Briefly list strengths and weaknesses of this display. Cite specific principles of good graphs, as well as offering your own general interpretation.
(Essay)
4.9/5 (37)
A dot plot would be useful in visualizing scores on an exam in a class of 30 students.
(True/False)
4.9/5 (29)
Briefly list strengths and weaknesses of this display. Cite specific principles of good graphs, as well as offering your own general interpretation.
(Essay)
4.9/5 (36)
Briefly list strengths and weaknesses of this display. Cite specific principles of good graphs, as well as offering your own general interpretation.
(Essay)
4.7/5 (25)
Log scales are common because most people are familiar with them.
(True/False)
4.8/5 (42)
Filters
- Essay(0)
- Multiple Choice(0)
- Short Answer(0)
- True False(0)
- Matching(0)