Exam 2: Frequency Distributions
Exam 1: Introduction to Statistics76 Questions
Exam 2: Frequency Distributions74 Questions
Exam 3: Central Tendency75 Questions
Exam 4: Variability75 Questions
Exam 5: Z-Scores: Location of Scores and Standardized Distributions77 Questions
Exam 6: Probability76 Questions
Exam 7: Probability and Samples: the Distribution of Sample Means77 Questions
Exam 8: Introduction to Hypothesis Testing76 Questions
Exam 9: Introduction to the T Statistic74 Questions
Exam 10: The T Test for Two Independent Samples75 Questions
Exam 11: The T Test for Two Related Samples76 Questions
Exam 12: Introduction to Analysis of Variance74 Questions
Exam 13: Repeated-Measures Analysis of Variance Anova75 Questions
Exam 14: Two-Factor Analysis of Variance Independent Measures75 Questions
Exam 15: Correlation76 Questions
Exam 16: Introduction to Regression75 Questions
Exam 17: The Chi-Square Statistic: Tests for Goodness of Fit and Independence75 Questions
Exam 18: The Binomial Test75 Questions
Select questions type
A grouped frequency distribution table lists one interval as,20-29.The width of this interval is 9 points.
(True/False)
4.9/5  (29)
(29)
What is the total number of scores for the distribution shown in the following table?? 4 3 3 5 2 4 1 2
(Multiple Choice)
4.7/5 (38)
For the distribution in the following table,the percentile rank for X = 25 is 82%.? \% 25-29 100\% 20-24 80\% 15-19 20\%
(True/False)
4.8/5 (36)
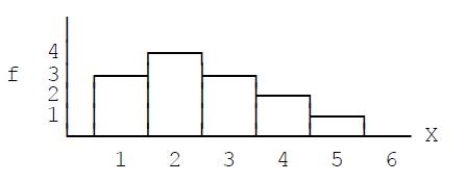 Figure 2-2
-What is the shape for the distribution shown in the accompanying graph in Figure 2.2?
Figure 2-2
-What is the shape for the distribution shown in the accompanying graph in Figure 2.2?
(Multiple Choice)
4.8/5 (35)
What kind of frequency distribution graph shows the frequencies as bars that are separated by spaces?
(Multiple Choice)
4.9/5 (34)
For the following distribution of scores,SX2 = 92.? X f 4 1 3 2 2 3 1 2
(True/False)
4.7/5 (32)
What term is used to describe the shape of a distribution in which the scores pile up on the left-hand side of the graph and taper off to the right?
(Multiple Choice)
4.9/5 (43)
Figure 2-2
-A skewed distribution typically has ____ tail(s)and a normal distribution has ____ tail(s).
(Multiple Choice)
4.8/5 (35)
For the following distribution,what is the width of each class interval?? X f 20-24 2 5-19 5 10-14 4 5-9 1 ?
(Multiple Choice)
4.8/5 (33)
For the following frequency distribution of quiz scores,how many individuals took the quiz?? 5 6 4 5 3 5 2 3 1 2
(Multiple Choice)
4.8/5 (37)
For the following distribution of quiz scores,if a score of X = 3 or higher is needed for a passing grade,how many individuals passed?? 5 6 4 5 3 5 2 3 1 2
(Multiple Choice)
4.8/5 (34)
Construct a stem and leaf display for the following scores.30,23,58,28,35,67,27,42,46,3551,33,18,33,25,38,48,36,31,39
(Essay)
5.0/5 (35)
What frequency distribution graph is appropriate for scores measured on a nominal scale?
(Multiple Choice)
4.9/5 (36)
For the following distribution of scores,SX = 18.? X f 4 1 3 2 2 3 1 2
(True/False)
4.7/5 (39)
In the following distribution,the scores are grouped into class intervals that are each 5 points wide.? 20-24 2 15-19 5 10-14 4 5-9 1
(True/False)
4.9/5 (35)
The scores for a very easy exam would probably form a positively skewed distribution.
(True/False)
4.9/5 (47)
Find each value requested for the set of scores in the following frequency distribution table.
a. n Score 5 1 4 2 3 3 2 5 1 2
b. ΣX
c. ΣX2
(Short Answer)
4.8/5 (35)
For the distribution in the following table,what is the 50th percentile?? \% 9 100\% 8 80\% 7 50\% 6 25\%
(Multiple Choice)
4.8/5 (36)
A score equal to the 5th percentile is one of the highest scores in the distribution.
(True/False)
4.8/5 (37)
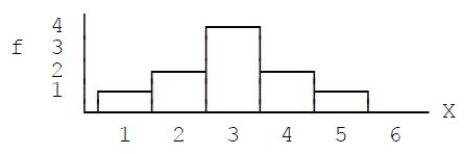 Figure 2.1
-For the distribution in the accompanying graph,Figure 2.1,what is the value of ΣX?
Figure 2.1
-For the distribution in the accompanying graph,Figure 2.1,what is the value of ΣX?
(Multiple Choice)
4.9/5 (39)
Filters
- Essay(0)
- Multiple Choice(0)
- Short Answer(0)
- True False(0)
- Matching(0)