Exam 12: Queueing Models
Exam 1: Introduction28 Questions
Exam 2: Linear Programming: Basic Concepts83 Questions
Exam 3: Linear Programming: Formulation and Applications58 Questions
Exam 4: The Art of Modeling With Spreadsheets31 Questions
Exam 5: What-If Analysis for Linear Programming63 Questions
Exam 6: Network Optimization Problems48 Questions
Exam 7: Using Binary Integer Programming to Deal With Yes-Or-No Decisions26 Questions
Exam 8: Nonlinear Programming53 Questions
Exam 9: Decision Analysis77 Questions
Exam 10: Cd Supplement - Decision Analysis26 Questions
Exam 11: Forecasting76 Questions
Exam 12: Queueing Models75 Questions
Exam 13: CD Supplement - Additional Queueing Models8 Questions
Exam 14: Computer Simulation: Basic Concepts45 Questions
Exam 15: CD Supplement - the Inverse Transformation Method for Generating Random Observations2 Questions
Exam 16: Computer Simulation With Crystal Ball53 Questions
Exam 17: CD - Solution Concepts for Linear Programming45 Questions
Exam 18: CD - Transportation and Assignment Problems48 Questions
Exam 19: CD - Pertcpm Models for Project Management93 Questions
Exam 20: CD - Goal Programming21 Questions
Exam 21: CD - Inventory Management With Known Demand64 Questions
Exam 22: CD - Inventory Management With Uncertain Demand43 Questions
Select questions type
The reason for using priorities is to decrease the waiting times for high-priority customers.
(True/False)
4.8/5  (29)
(29)
The standard deviation for the degenerative distribution equals zero.
(True/False)
4.7/5 (29)
The utilization factor is the ratio of the arrival rate to the service rate.
(True/False)
4.8/5 (27)
Figure
Refer to the following data for a multiple-server,nonpreemptive priority queueing model: 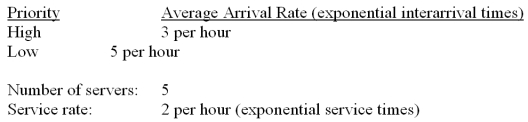 -What is the average number of low priority items waiting in line for service?
(Multiple Choice)
5.0/5 (38)
For a system that has a high utilization factor,decreasing the service rate will have only a negligible effect on customer waiting time.
(True/False)
4.9/5 (35)
Figure
Refer to the following data for a multiple-server,nonpreemptive priority queueing model:
-What is the average number of high priority items waiting in line for service?
(Multiple Choice)
5.0/5 (31)
Queue discipline refers to the willingness of customers to wait in line for service.
(True/False)
5.0/5 (33)
The goal of queuing analysis is to minimize customer waiting lines.
(True/False)
4.9/5 (43)
The exponential distribution will always provide a reasonably close approximation of the true service-time distribution.
(True/False)
4.8/5 (36)
On average,how much longer in minutes do parties of non-truckers spend in the system,compared to parties of truckers?
(Multiple Choice)
4.8/5 (30)
Figure
Refer to the following data for a multiple-server,nonpreemptive priority queueing model:
-What is the average time in the system (in minutes)for a low priority item?
(Multiple Choice)
4.9/5 (43)
Most queueing models assume that the form of the probability distribution of interarrival times is an exponential distribution.
(True/False)
4.8/5 (33)
All single-server queueing models require the utilization factor to be less than 1.
(True/False)
4.9/5 (25)
A multiple-server queueing system with an exponential arrival rate and service time has a mean arrival rate of 4 customers per hour and a mean service time of 18 minutes per customer.The minimum number of servers required to keep the utilization factor under 1 is:
(Multiple Choice)
4.8/5 (33)
Figure
Refer to the following data for a multiple-server,nonpreemptive priority queueing model:
-What is the approximate average time in minutes that non-truckers wait to be seated?
(Multiple Choice)
4.9/5 (35)
Filters
- Essay(0)
- Multiple Choice(0)
- Short Answer(0)
- True False(0)
- Matching(0)