Exam 3: Financial Statements and Ratio Analysis
Exam 1: The Role of Managerial Finance133 Questions
Exam 2: The Financial Market Environment91 Questions
Exam 3: Financial Statements and Ratio Analysis209 Questions
Exam 4: Cash Flow and Financial Planning183 Questions
Exam 5: Time Value of Money173 Questions
Exam 6: Interest Rates and Bond Valuation224 Questions
Exam 7: Stock Valuation188 Questions
Exam 8: Risk and Return190 Questions
Exam 9: The Cost of Capital137 Questions
Exam 10: Capital Budgeting Techniques167 Questions
Exam 11: Capital Budgeting Cash Flows117 Questions
Exam 12: Risk and Refinements in Capital Budgeting106 Questions
Exam 13: Leverage and Capital Structure217 Questions
Exam 14: Payout Policy130 Questions
Exam 15: Working Capital and Current Assets Management340 Questions
Exam 16: Current Liabilities Management171 Questions
Exam 17: Hybrid and Derivative Securities185 Questions
Exam 18: Mergers, Lbos, Divestitures, and Business Failure191 Questions
Exam 19: International Managerial Finance108 Questions
Select questions type
The Sarbanes-Oxley Act of 2002 established the Private Company Accounting Oversight Board (PCAOB) which is a for-profit corporation that oversees CEOs of public corporations.
(True/False)
4.8/5  (40)
(40)
The ________ ratio measures the proportion of total assets financed by the firm's creditors.
(Multiple Choice)
4.9/5 (45)
Time-series analysis evaluates performance of firms at the same point in time using financial ratios.
(True/False)
4.7/5 (34)
The financial leverage multiplier is the ratio of the firm's total assets to stockholders' equity.
(True/False)
4.8/5 (31)
The ________ ratio may indicate the firm is experiencing stockouts and lost sales.
(Multiple Choice)
5.0/5 (34)
Earnings per share results from dividing earnings available for common stockholders by the number of shares of common stock authorized.
(True/False)
4.8/5 (34)
The two categories of ratios that should be utilized to assess a firm's true liquidity are the
(Multiple Choice)
4.9/5 (33)
The analyst should be careful when conducting ratio analysis to ensure that
(Multiple Choice)
4.9/5 (41)
Table 3.2
Dana Dairy Products Key Ratios 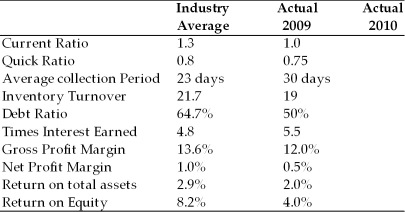 Income Statement
Dana Dairy Products
For the Year Ended December 31, 2010
Income Statement
Dana Dairy Products
For the Year Ended December 31, 2010 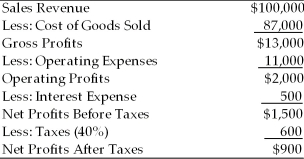 Balance Sheet
Dana Dairy Products
December 31, 2010
Balance Sheet
Dana Dairy Products
December 31, 2010 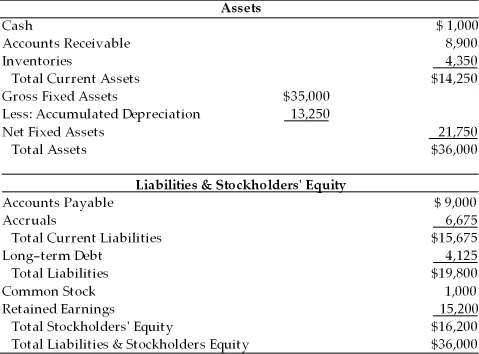 -The gross profit margin and net profit margin for Dana Dairy Products in 2010 were ________. (See Table 3.2)
(Multiple Choice)
4.7/5 (33)
A U.S. parent company's foreign equity accounts are translated into dollars using the exchange rate that prevailed when the parent's equity investment was made (the historical rate).
(True/False)
4.8/5 (30)
A firm with a substandard return on total assets can improve its return on equity, all else remaining the same, by
(Multiple Choice)
4.9/5 (40)
The current ratio provides a better measure of overall liquidity only when a firm's inventory cannot easily be converted into cash. If inventory is liquid, the quick ratio is a preferred measure of overall liquidity.
(True/False)
4.8/5 (25)
Publicly-owned corporations are those which are financed by the proceeds from the treasury securities.
(True/False)
4.9/5 (36)
FASB Standard No. 52 mandates that U.S. based companies must translate their foreign-currency-denominated assets and liabilities into dollars using the
(Multiple Choice)
4.8/5 (35)
Earnings per share represent the dollar amount earned and distributed to shareholders.
(True/False)
4.8/5 (30)
Ag Silver Mining, Inc. has $500,000 of earnings before interest and taxes at the year end. Interest expenses for the year were $10,000. The firm expects to distribute $100,000 in dividends. Calculate the earnings after taxes for the firm assuming a 40 percent tax on ordinary income.
(Essay)
4.8/5 (37)
The ________ measures the percentage of each sales dollar remaining after ALL expenses, including taxes, have been deducted.
(Multiple Choice)
4.8/5 (30)
Given the following balance sheet, income statement, historical ratios and industry averages, calculate the Pulp, Paper, and Paperboard, Inc. financial ratios for the most recent year. Analyze its overall financial situation for the most recent year. Analyze its overall financial situation from both a cross-sectional and time-series viewpoint. Break your analysis into an evaluation of the firm's liquidity, activity, debt, and profitability.
Income Statement
Pulp, Paper and Paperboard, Inc.
For the Year Ended December 31, 2005  Balance Sheet
Pulp, Paper and Paperboard, Inc.
December 31, 2005
Balance Sheet
Pulp, Paper and Paperboard, Inc.
December 31, 2005 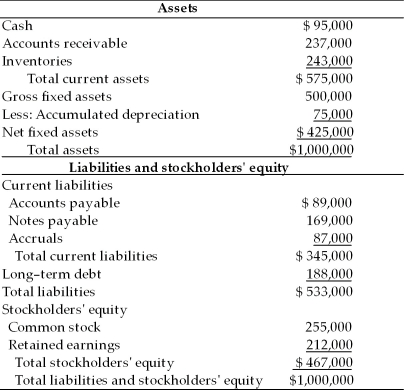 Historical and Industry Average Ratios
Pulp, Paper and Paperboard, Inc.
Historical and Industry Average Ratios
Pulp, Paper and Paperboard, Inc. 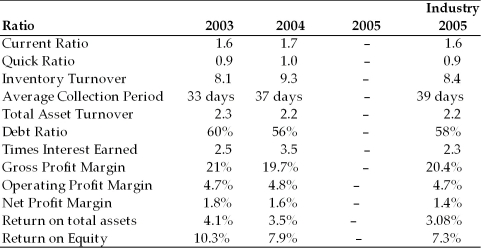
(Essay)
4.7/5 (37)
Filters
- Essay(0)
- Multiple Choice(0)
- Short Answer(0)
- True False(0)
- Matching(0)