Exam 12: Aggregate Demand and Aggregate Supply
Exam 1: Limits, Alternatives, and Choices257 Questions
Exam 2: The Market System and the Circular Flow112 Questions
Exam 3: Demand, Supply, and Market Equilibrium284 Questions
Exam 4: Market Failures: Public Goods and Externalities122 Questions
Exam 5: Governments Role and Government Failure109 Questions
Exam 6: An Introduction to Macroeconomics58 Questions
Exam 7: Measuring the Economys Output181 Questions
Exam 8: Economic Growth112 Questions
Exam 9: Business Cycles, Unemployment, and Inflation184 Questions
Exam 10: Basic Macroeconomic Relationships187 Questions
Exam 11: The Aggregate Expenditures Model230 Questions
Exam 12: Aggregate Demand and Aggregate Supply229 Questions
Exam 13: Fiscal Policy, Deficits, Surpluses, and Debt223 Questions
Exam 14: Money, Banking, and Money Creation203 Questions
Exam 15: Interest Rates and Monetary Policy238 Questions
Exam 16: Long-Run Macroeconomic Adjustments119 Questions
Exam 17: International Trade181 Questions
Exam 18: Exchange Rates and the Balance of Payments127 Questions
Select questions type
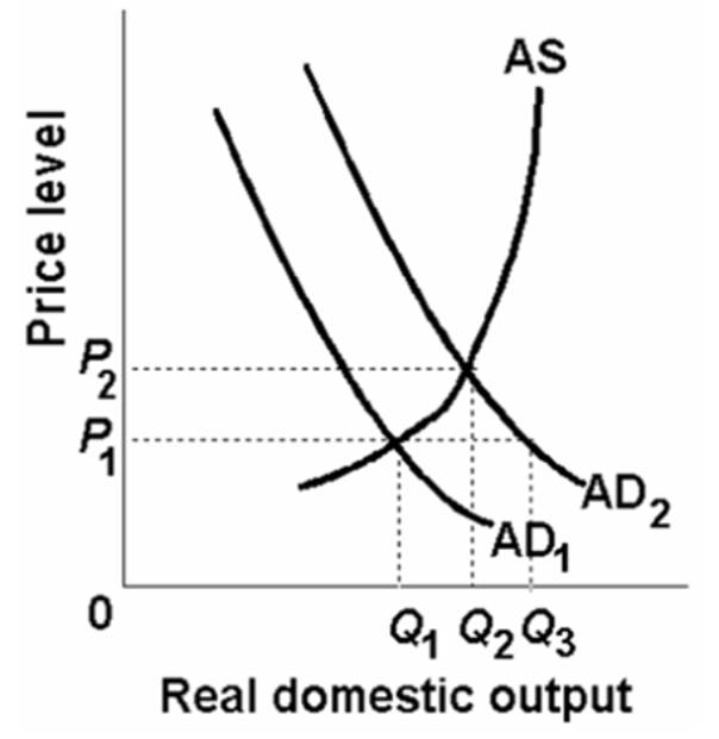 -Refer to the above diagram.If the equilibrium price level is P1,then:
(Multiple Choice)
5.0/5  (29)
(29)
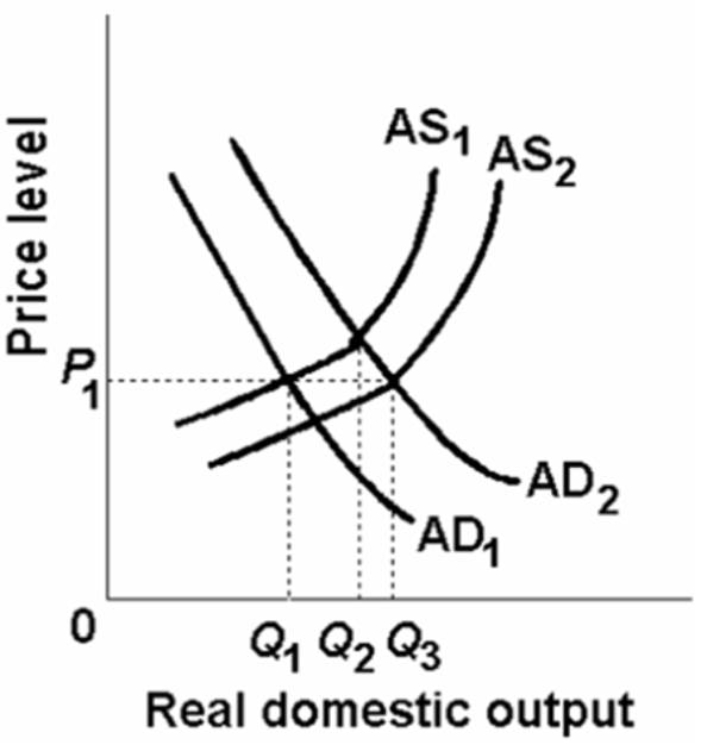 -In the above figure AD1 and AS1 represent the original aggregate supply and demand curves and AD2 and AS2 show the new aggregate demand and supply curves.At the original equilibrium price and quantity,this economy is experiencing:
(Multiple Choice)
4.8/5 (29)
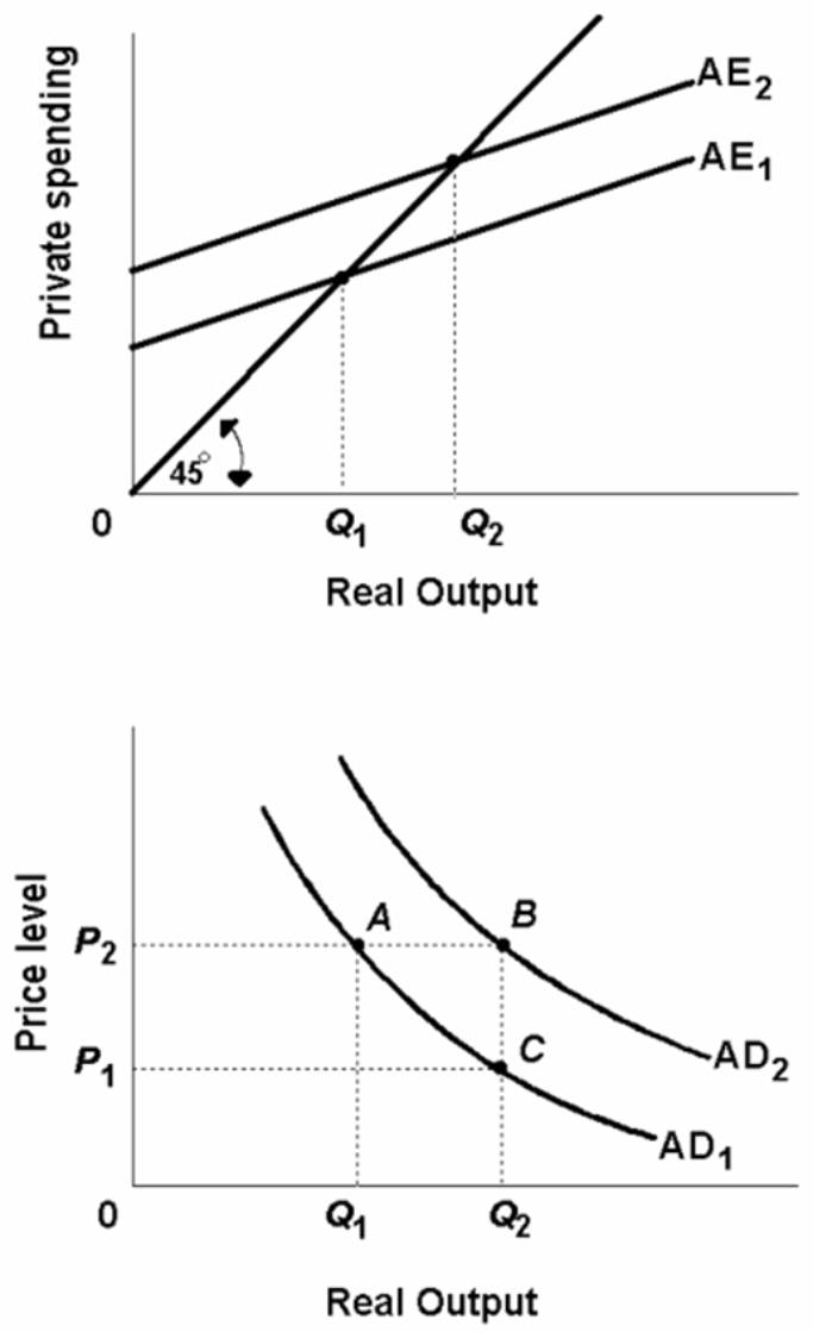 -Refer to the above diagrams.Assuming a constant price level,an increase in aggregate expenditures from AE1 to AE2 would:
(Multiple Choice)
4.9/5 (46)
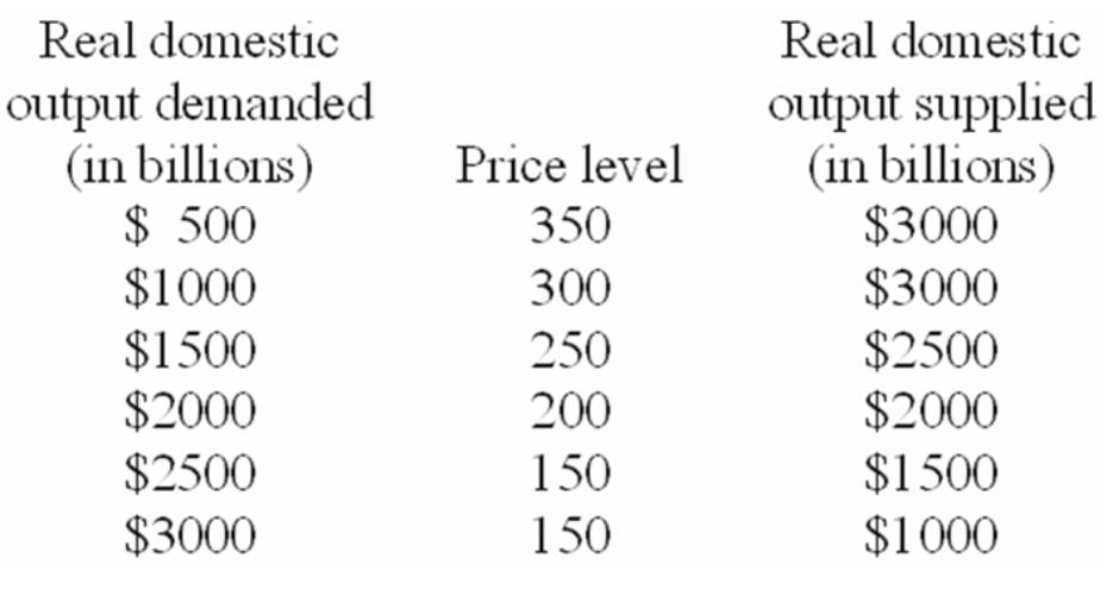
Suppose the aggregate demand and short-run aggregate supply schedules for a hypothetical economy are as shown below:
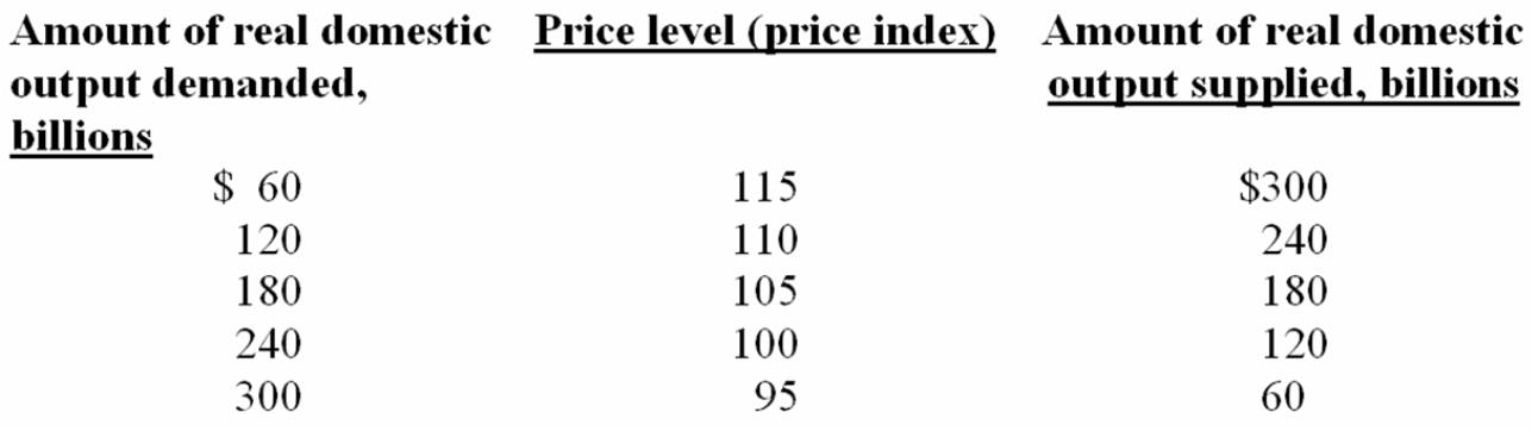 (a)What will be the equilibrium price and real output level in this hypothetical economy? Is this level of real GDP also the full-employment level of output? Explain.
(b)Why won't a price level of 100 be the equilibrium price level? Why won't a price level of 110 index be the equilibrium price level?
(c)Suppose aggregate demand increases by $120 billion at each price level.What will be the new equilibrium price and output levels?
(d)What factors might cause aggregate demand to increase?
(e)Suppose short-run aggregate supply increases by $120 billion at each price level.What will be the new equilibrium price and output levels?
(a)What will be the equilibrium price and real output level in this hypothetical economy? Is this level of real GDP also the full-employment level of output? Explain.
(b)Why won't a price level of 100 be the equilibrium price level? Why won't a price level of 110 index be the equilibrium price level?
(c)Suppose aggregate demand increases by $120 billion at each price level.What will be the new equilibrium price and output levels?
(d)What factors might cause aggregate demand to increase?
(e)Suppose short-run aggregate supply increases by $120 billion at each price level.What will be the new equilibrium price and output levels?
(Essay)
4.9/5 (37)
 -Refer to the above diagram.When output increases from Q1 and the price level decreases from P1,this change will:
(Multiple Choice)
4.7/5 (37)
Refer to the data below.The vertical range of the aggregate supply curve is associated with price levels:
The following aggregate demand and supply schedules are for a hypothetical economy: 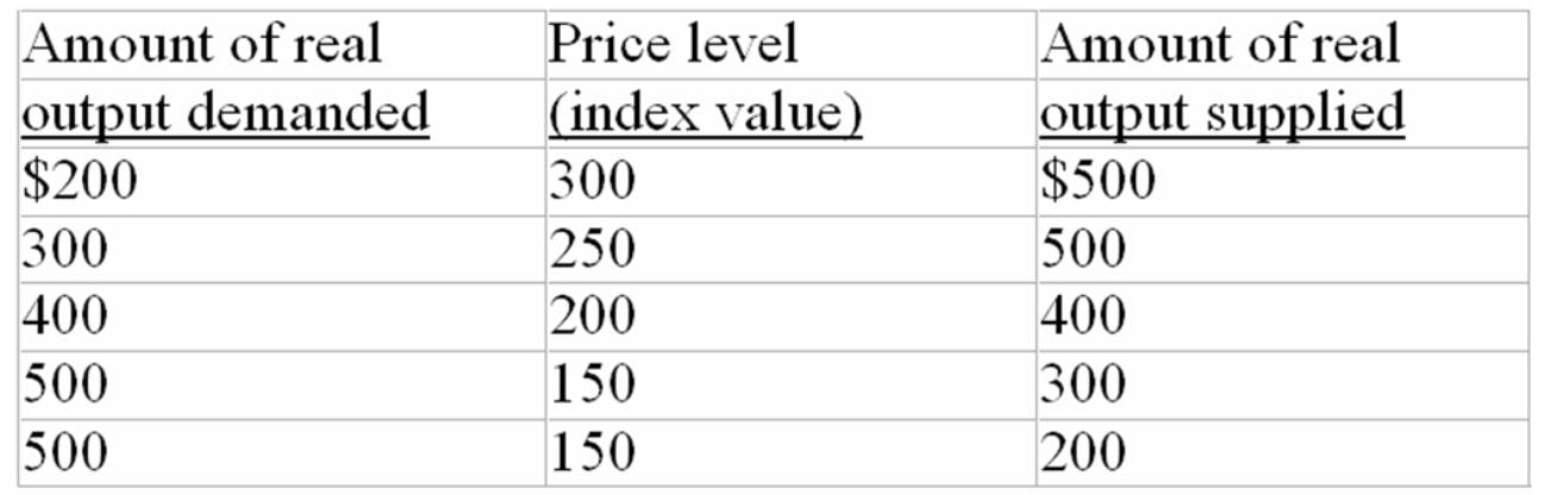
(Multiple Choice)
4.8/5 (35)
Refer to the table below.If this nation's aggregate supply schedule graphs as a vertical line at the $25 billion level of real GDP,its price level will be:
The following table is for a particular country in which C is consumption expenditures,Ig is gross investment expenditures,G is government expenditures,X is exports,and M is imports.All figures are in billions of dollars. 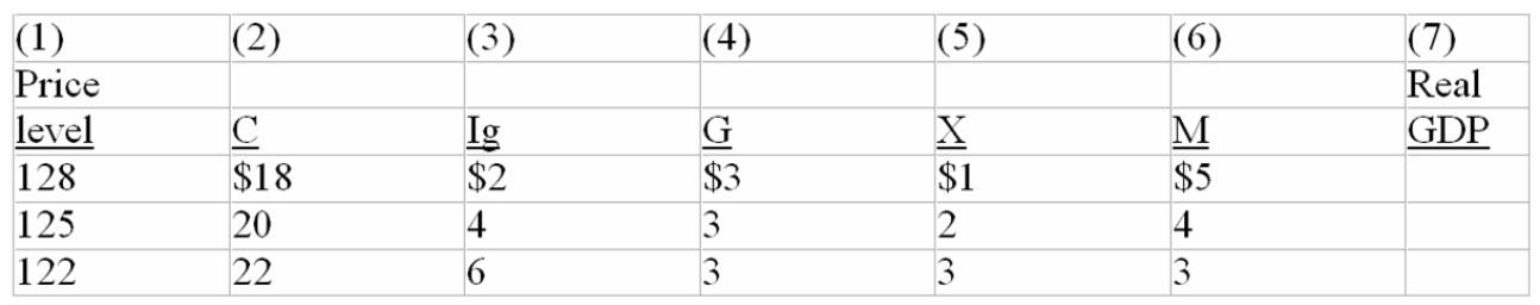
(Multiple Choice)
4.8/5 (41)
Refer to the above diagram.If the price level rises above P1 because of an increase in aggregate demand,the:
(Multiple Choice)
4.8/5 (34)
 -Refer to the above diagram.If AD1 shifts to AD2,then the equilibrium output and price level are:
(Multiple Choice)
4.8/5 (31)
Changes in which of the two factors below would most likely cause a change in consumer spending?
The following list of factors,are related to the aggregate demand curve. 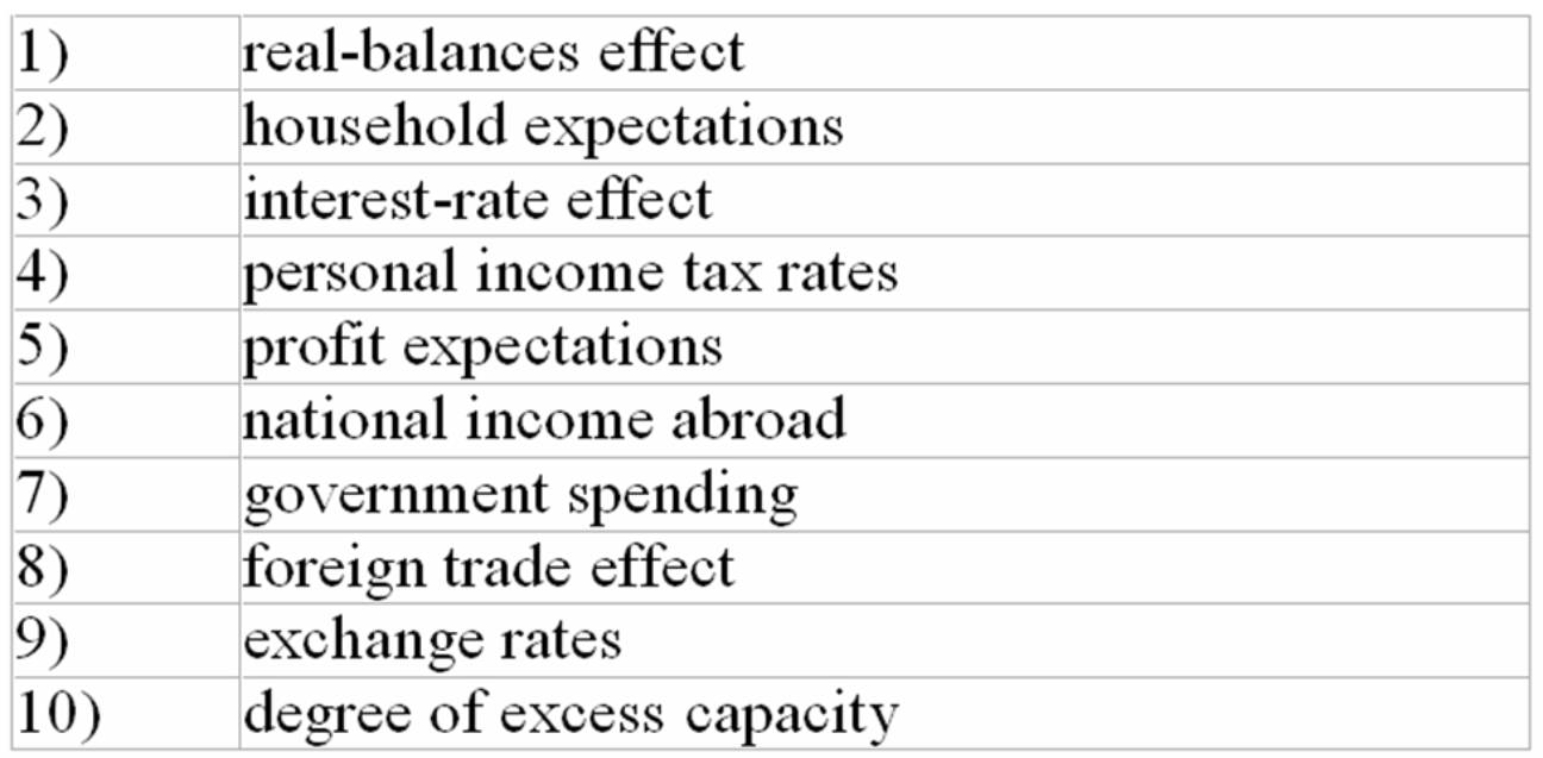
(Multiple Choice)
4.9/5 (28)
The following table shows the aggregate demand and aggregate supply schedule for a hypothetical economy.
 -Refer to the above table.The equilibrium price level and quantity of real domestic output will be:
(Multiple Choice)
4.8/5 (24)
Describe the change in short-run aggregate supply that should result from each of the following changes in determinants.Assume that nothing else is changing besides the identified change.(Use "Decrease" or "Increase.")
(a)A rise in the average price of inputs;
(b)An increase in worker productivity;
(c)Government antipollution regulations become stricter;
(d)A new subsidy program is enacted for new business investment in productive equipment;
(e)Energy prices decline.
(Essay)
4.8/5 (33)
The aggregate demand curve can be derived from the aggregate expenditures model as indicated by the fact that:
(Multiple Choice)
4.7/5 (26)
A rightward shift in the aggregate supply curve might best be explained by:
(Multiple Choice)
4.7/5 (26)
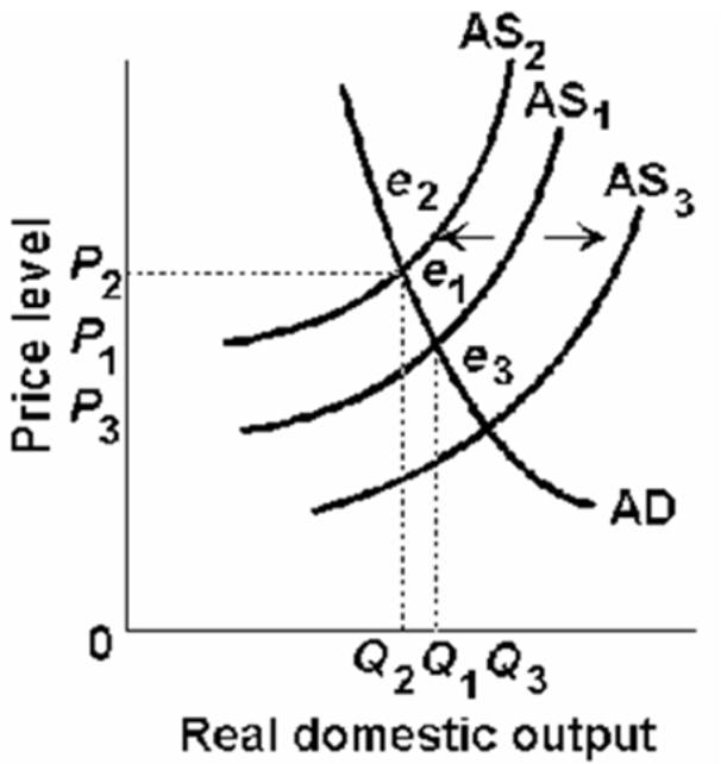
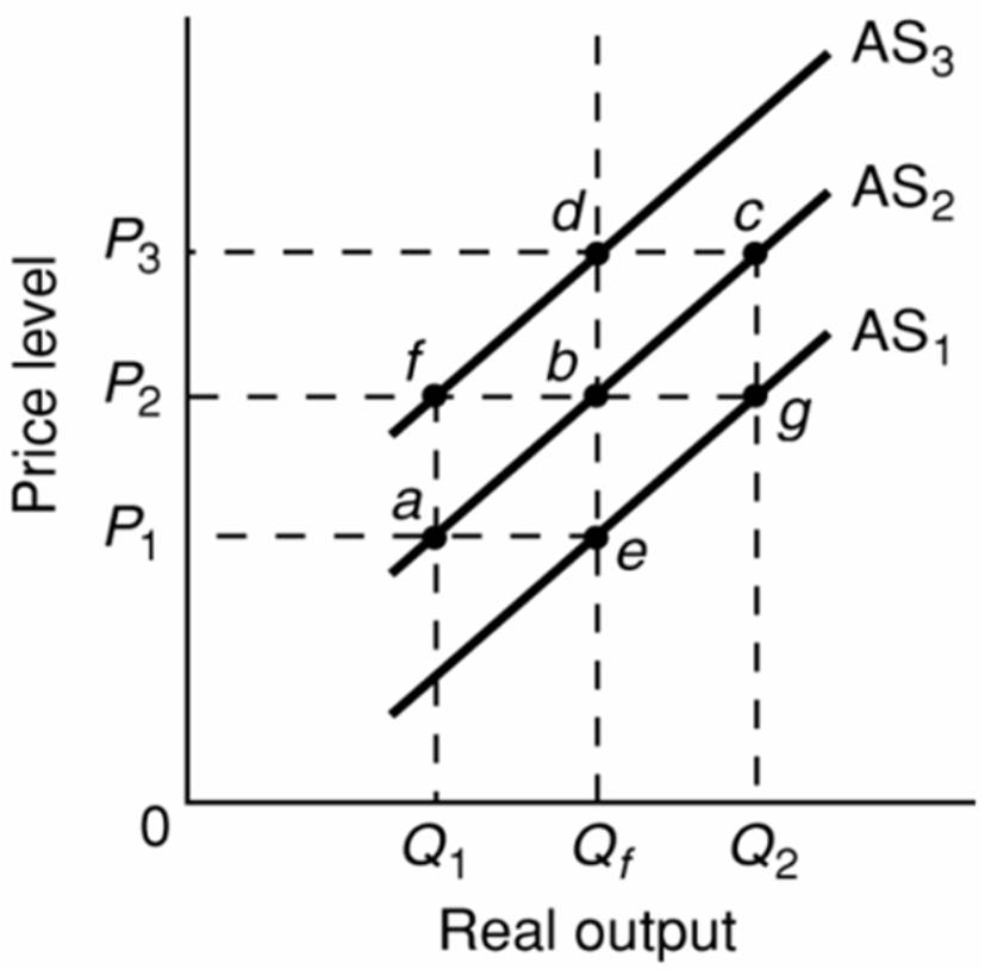 -Refer to the above diagram.Assume that nominal wages initially are set on the basis of the price level P2 and that the economy initially is operating at its full-employment level of output Qf.In the long run,demand-pull inflation could best be shown as:
(Multiple Choice)
4.9/5 (34)
Using the aggregate demand-aggregate supply (short-run)model,explain the impact of the public's expectations of severe inflation on real GDP and the price level.
(Essay)
4.7/5 (34)
An increase in aggregate expenditures resulting from a decrease in the price level is equivalent to a:
(Multiple Choice)
4.8/5 (33)
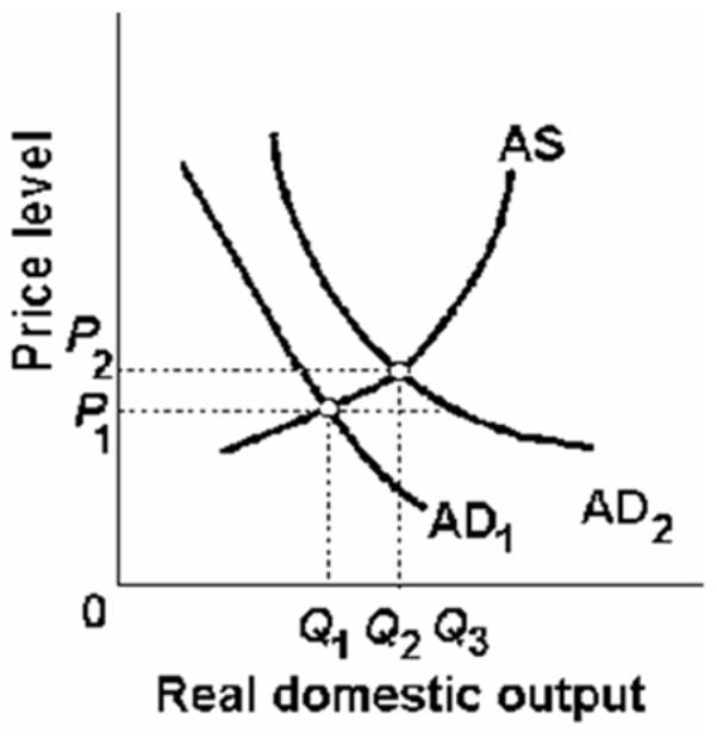
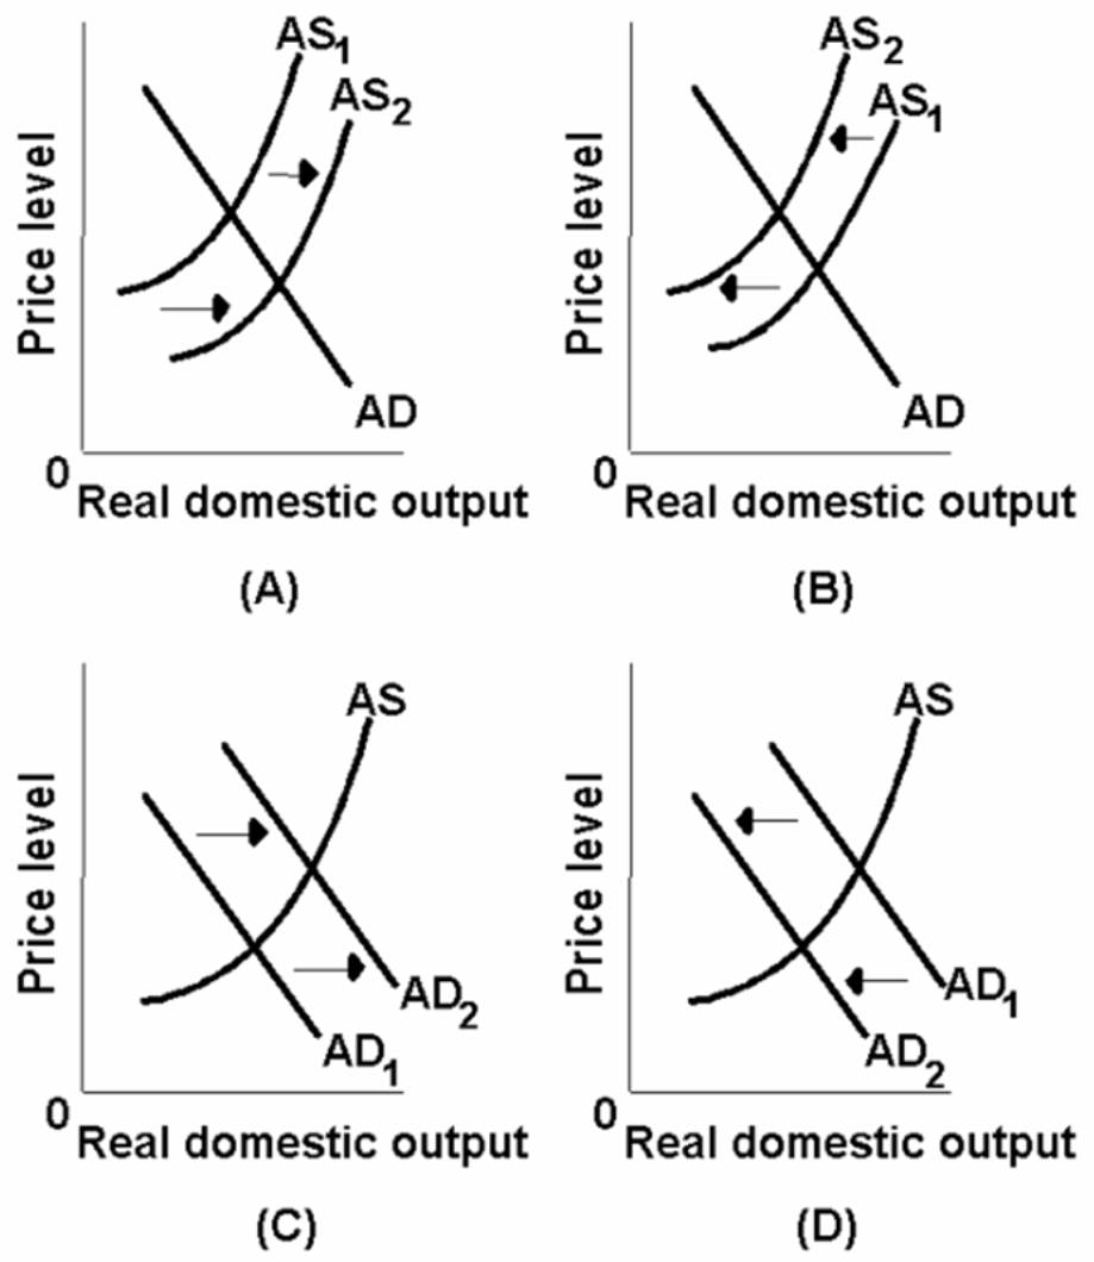 -Which of the above diagrams best portrays the effects of an increase in foreign spending on our products?
(Multiple Choice)
4.8/5 (33)
Filters
- Essay(0)
- Multiple Choice(0)
- Short Answer(0)
- True False(0)
- Matching(0)