Exam 12: Aggregate Demand and Aggregate Supply
Exam 1: Limits, Alternatives, and Choices257 Questions
Exam 2: The Market System and the Circular Flow112 Questions
Exam 3: Demand, Supply, and Market Equilibrium284 Questions
Exam 4: Market Failures: Public Goods and Externalities122 Questions
Exam 5: Governments Role and Government Failure109 Questions
Exam 6: An Introduction to Macroeconomics58 Questions
Exam 7: Measuring the Economys Output181 Questions
Exam 8: Economic Growth112 Questions
Exam 9: Business Cycles, Unemployment, and Inflation184 Questions
Exam 10: Basic Macroeconomic Relationships187 Questions
Exam 11: The Aggregate Expenditures Model230 Questions
Exam 12: Aggregate Demand and Aggregate Supply229 Questions
Exam 13: Fiscal Policy, Deficits, Surpluses, and Debt223 Questions
Exam 14: Money, Banking, and Money Creation203 Questions
Exam 15: Interest Rates and Monetary Policy238 Questions
Exam 16: Long-Run Macroeconomic Adjustments119 Questions
Exam 17: International Trade181 Questions
Exam 18: Exchange Rates and the Balance of Payments127 Questions
Select questions type
A decrease in interest rates caused by a change in the price level would cause a(n):
(Multiple Choice)
4.9/5  (40)
(40)
When deriving the aggregate demand (AD)curve from the aggregate expenditure model,an increase in Canadian product prices would cause:
(Multiple Choice)
4.8/5 (39)
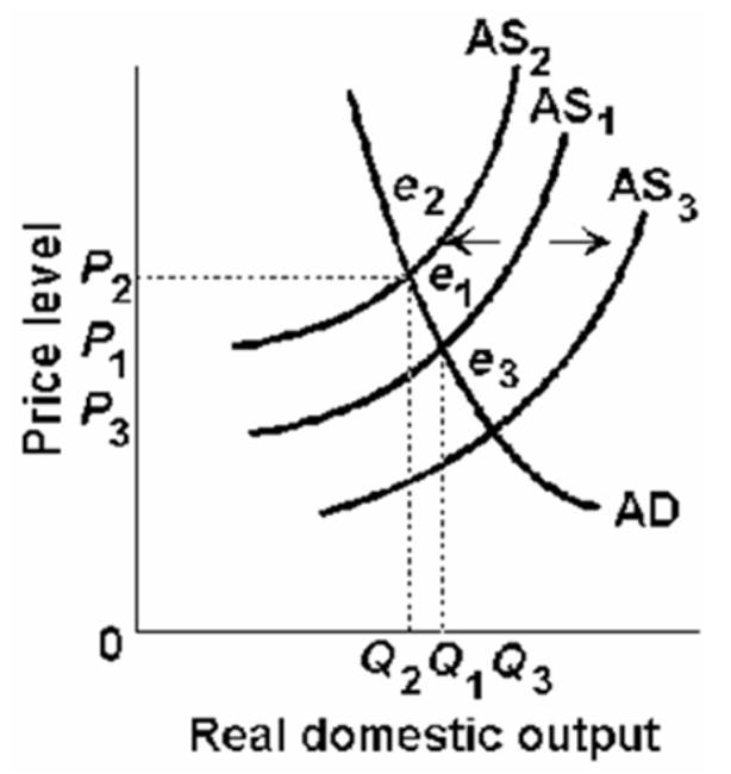 -Refer to the above diagram.Cost-push inflation can be illustrated by a:
(Multiple Choice)
4.8/5 (27)
The following table gives information about the relationship between input quantities and real domestic output in a hypothetical economy:
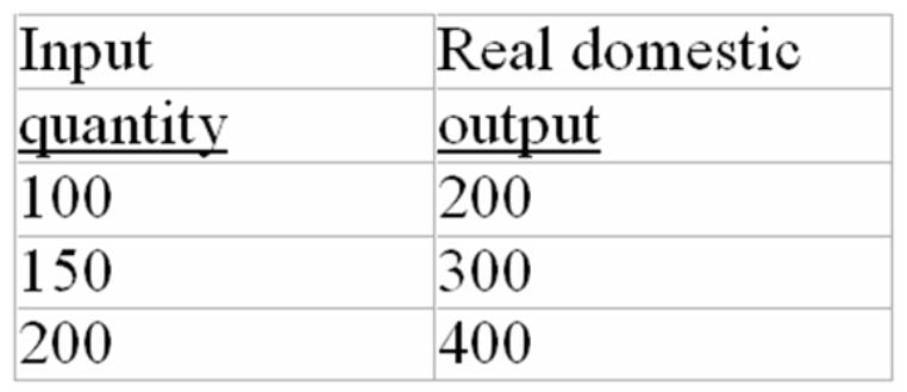 -Refer to the above information,the level of productivity is:
(Multiple Choice)
4.9/5 (38)
Which of the following explains why the aggregate demand schedule is downward sloping?
(Multiple Choice)
4.8/5 (34)
Using the aggregate demand-aggregate supply (short-run)model,explain how the depreciation of the Canadian dollar in terms of foreign currencies would affect the economy.
(Essay)
4.7/5 (29)
Which of the following would not shift the aggregate supply curve?
(Multiple Choice)
4.9/5 (32)
The shape of the aggregate demand curve is explained by the:
(Multiple Choice)
4.8/5 (37)
The recession that began in 2008 dispelled the idea of The Great Moderation.
(True/False)
4.8/5 (41)
Explain the relationship between the aggregate expenditures model in graph (A)below and the aggregate demand model in graph (B)below where aggregate demand is shifting.
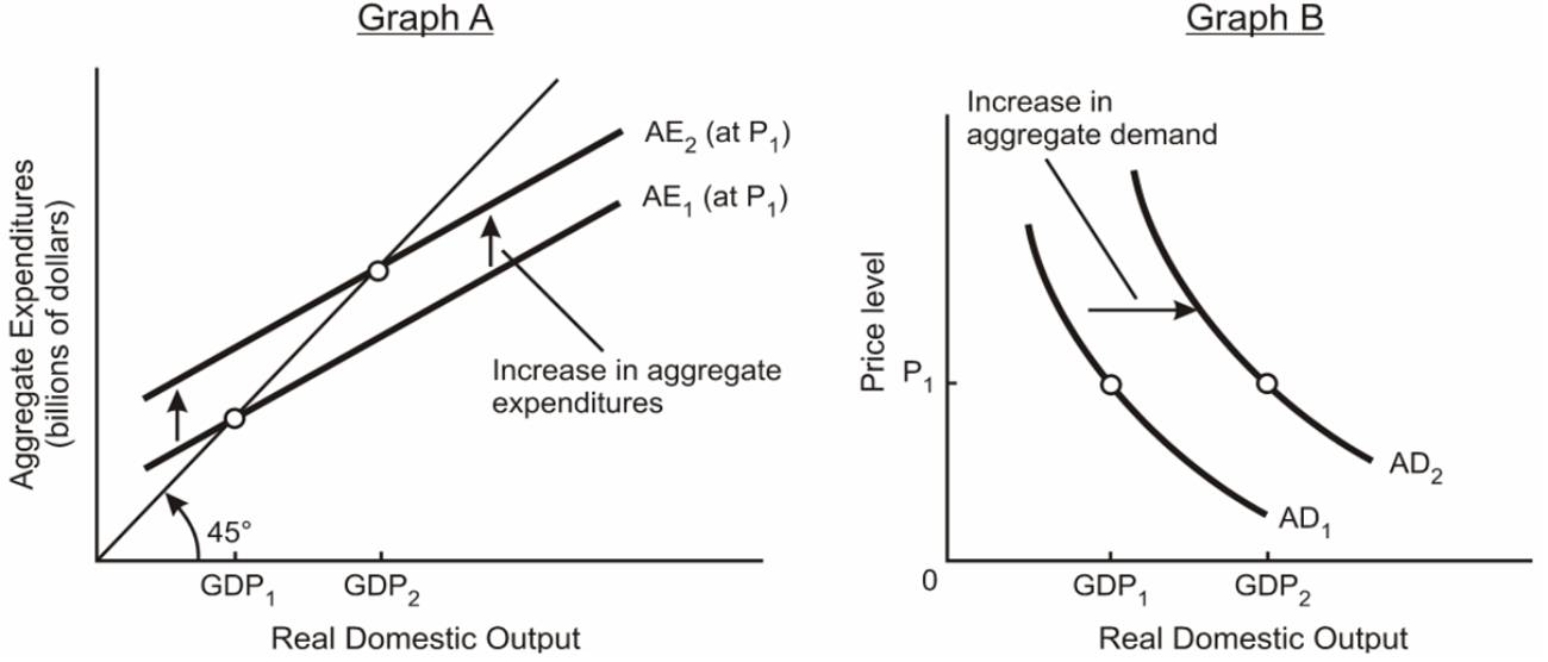
(Essay)
4.9/5 (33)
The following aggregate demand and supply schedules are for a hypothetical economy:
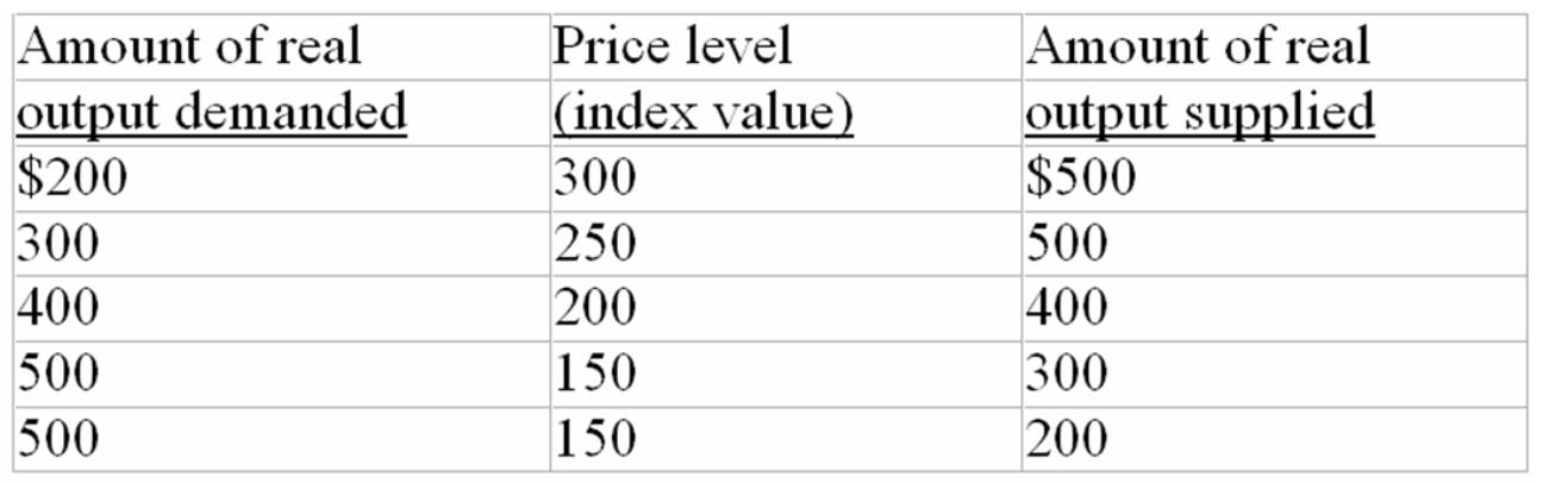 -Refer to the above data.If the price level is 150 and producers supply $300 of real output:
(Multiple Choice)
4.8/5 (33)
Which one of the following would increase per unit production cost and therefore shift the aggregate supply curve to the left?
(Multiple Choice)
4.8/5 (35)
Wage contracts,efficiency wages,and the minimum wage are explanations for why:
(Multiple Choice)
4.9/5 (33)
The relationship between the aggregate demand curve and the aggregate expenditures model is shown in the fact that:
(Multiple Choice)
4.9/5 (45)
The following list of items are related to aggregate demand and/or aggregate supply.
 -Refer to the above list.Changes in which combination of factors best explain why the aggregate supply curve would shift?
(Multiple Choice)
4.7/5 (35)
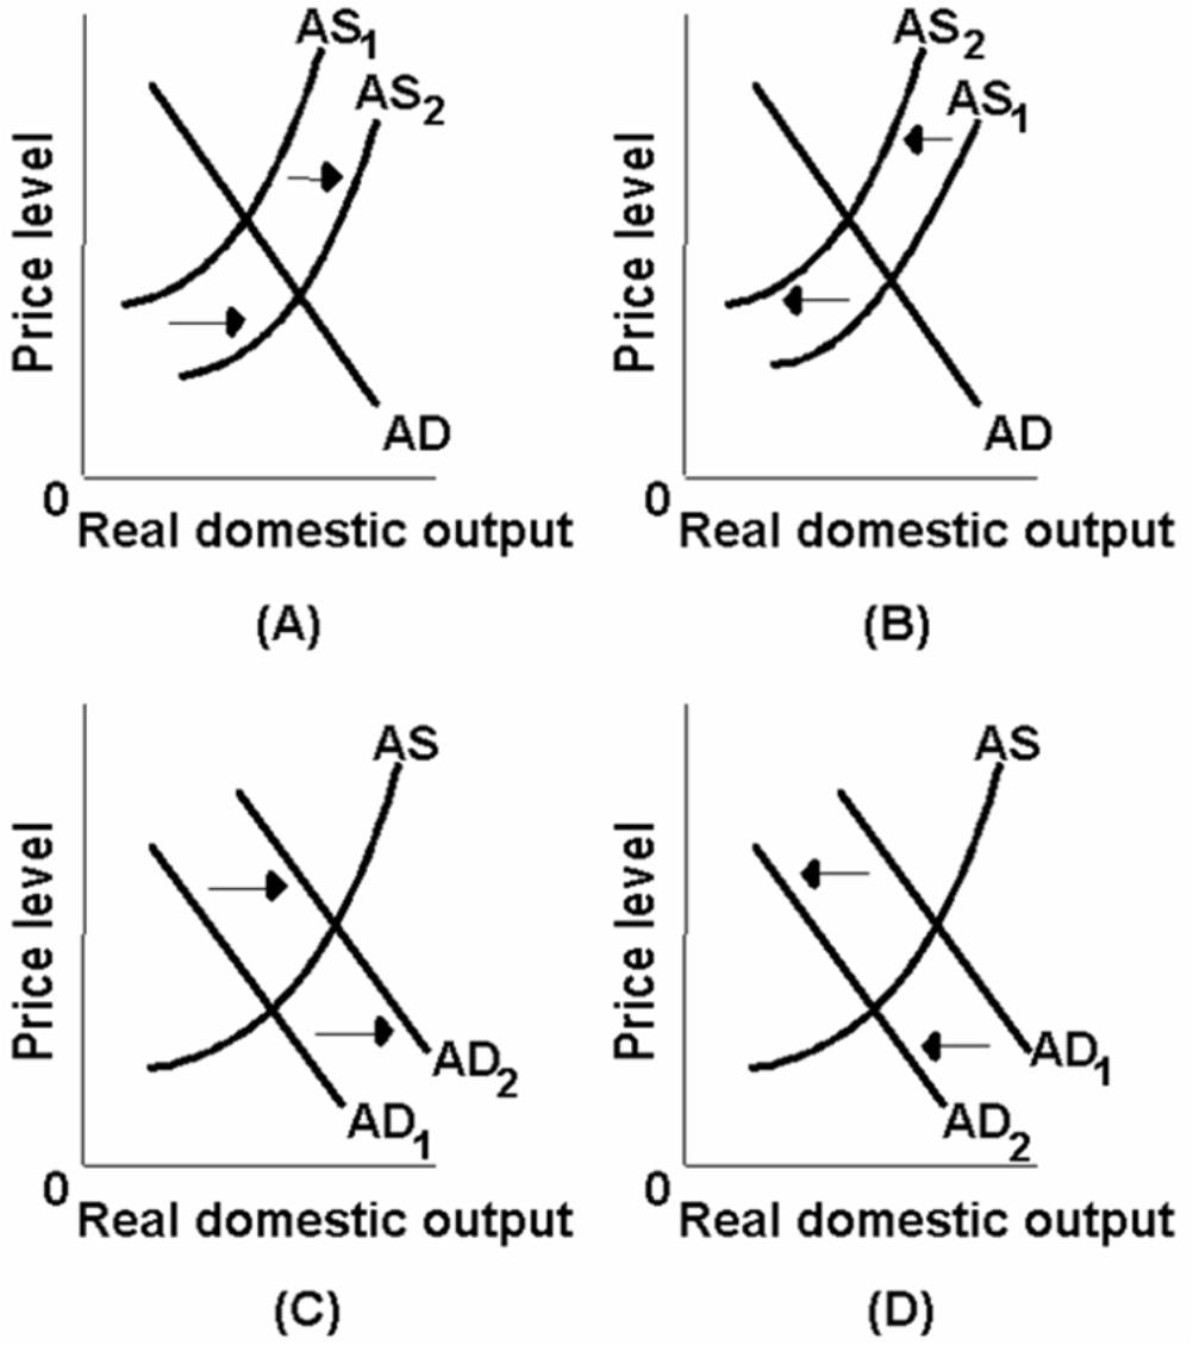 -Which of the above diagrams best portrays the effects of a dramatic increase in energy prices?
(Multiple Choice)
4.8/5 (27)
If real output rises and the price level falls,this would likely be due to a:
(Multiple Choice)
4.8/5 (34)
The equilibrium price level and level of real output occur where:
(Multiple Choice)
4.8/5 (35)
Filters
- Essay(0)
- Multiple Choice(0)
- Short Answer(0)
- True False(0)
- Matching(0)