Exam 12: Aggregate Demand and Aggregate Supply
Exam 1: Limits, Alternatives, and Choices257 Questions
Exam 2: The Market System and the Circular Flow112 Questions
Exam 3: Demand, Supply, and Market Equilibrium284 Questions
Exam 4: Market Failures: Public Goods and Externalities122 Questions
Exam 5: Governments Role and Government Failure109 Questions
Exam 6: An Introduction to Macroeconomics58 Questions
Exam 7: Measuring the Economys Output181 Questions
Exam 8: Economic Growth112 Questions
Exam 9: Business Cycles, Unemployment, and Inflation184 Questions
Exam 10: Basic Macroeconomic Relationships187 Questions
Exam 11: The Aggregate Expenditures Model230 Questions
Exam 12: Aggregate Demand and Aggregate Supply229 Questions
Exam 13: Fiscal Policy, Deficits, Surpluses, and Debt223 Questions
Exam 14: Money, Banking, and Money Creation203 Questions
Exam 15: Interest Rates and Monetary Policy238 Questions
Exam 16: Long-Run Macroeconomic Adjustments119 Questions
Exam 17: International Trade181 Questions
Exam 18: Exchange Rates and the Balance of Payments127 Questions
Select questions type
Which effect best explains the downward slope of the aggregate demand curve?
(Multiple Choice)
4.7/5  (41)
(41)
The following table shows the aggregate demand and aggregate supply schedule for a hypothetical economy.
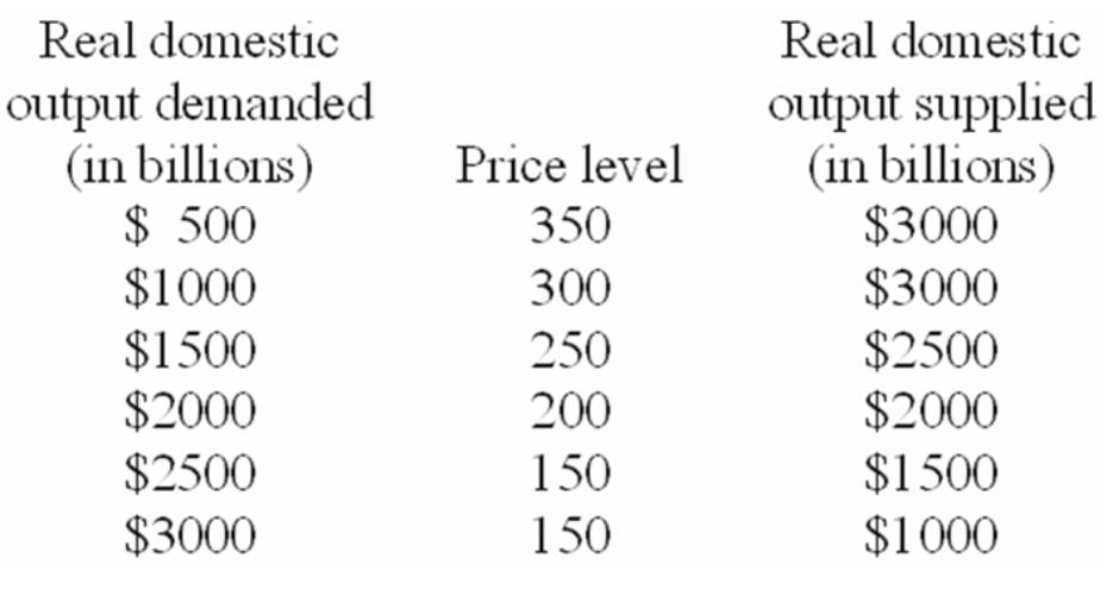 -Refer to the above table.If the quantity of real domestic output demanded decreased by $500 and the quantity of real domestic output supplied increased by $500 at each price level,the new equilibrium price level and quantity of real domestic output would be:
(Multiple Choice)
4.7/5 (31)
How can an economy already at full-employment expand without igniting inflation? Explain.
(Essay)
4.8/5 (50)
The Canadian economy was able to achieve full employment with relative price level stability in the early 2000 because aggregate:
(Multiple Choice)
4.8/5 (34)
Suppose that real domestic output in an economy is 20 units,the quantity of inputs is 10,and the price of each input is $4.
-Refer to the information above,the level of productivity is:
(Multiple Choice)
4.8/5 (31)
A n expected rise in the rate of inflation for consumer goods will:
(Multiple Choice)
4.8/5 (32)
An increase in wealth from a substantial increase in stock prices will move the economy along the existing aggregate demand curve.
(True/False)
4.8/5 (34)
An increase in the price level in the aggregate expenditures model would:
(Multiple Choice)
4.7/5 (45)
Refer to the diagram below.Suppose that aggregate demand increased from AD1to AD2.For the price level to stay constant: 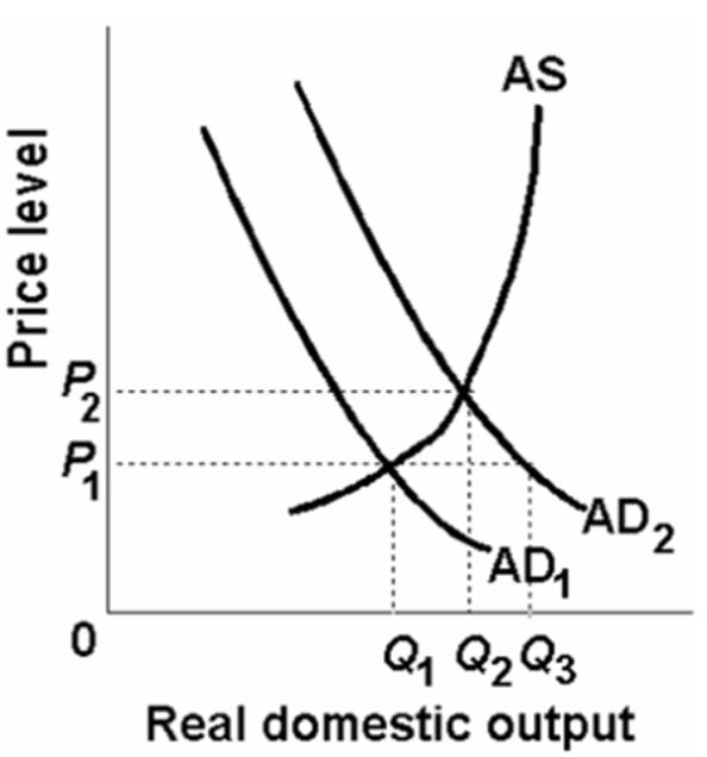
(Multiple Choice)
4.9/5 (27)
An increase in investment spending can be expected to shift the:
(Multiple Choice)
4.8/5 (25)
Suppose that real domestic output in an economy is 20 units,the quantity of inputs is 10,and the price of each input is $4.
-The per unit cost of production in the economy described above is:
(Multiple Choice)
4.9/5 (30)
Explain the three reasons given for the downward slope of the aggregate demand curve.
(Essay)
4.9/5 (34)
An economy is employing 2 units of capital,5 units of raw materials,and 8 units of labour to produce its total output of 640 units.Each unit of capital costs $10,each unit of raw materials,$4,and each unit of labour,$3.
-Refer to the above information.If the per unit price of raw materials rises from $4 to $8 and all else remains constant,the per unit cost of production will rise by about:
(Multiple Choice)
4.8/5 (43)
An increase in imports (independently of a change in our price level)will increase both aggregate supply and aggregate demand.
(True/False)
4.7/5 (41)
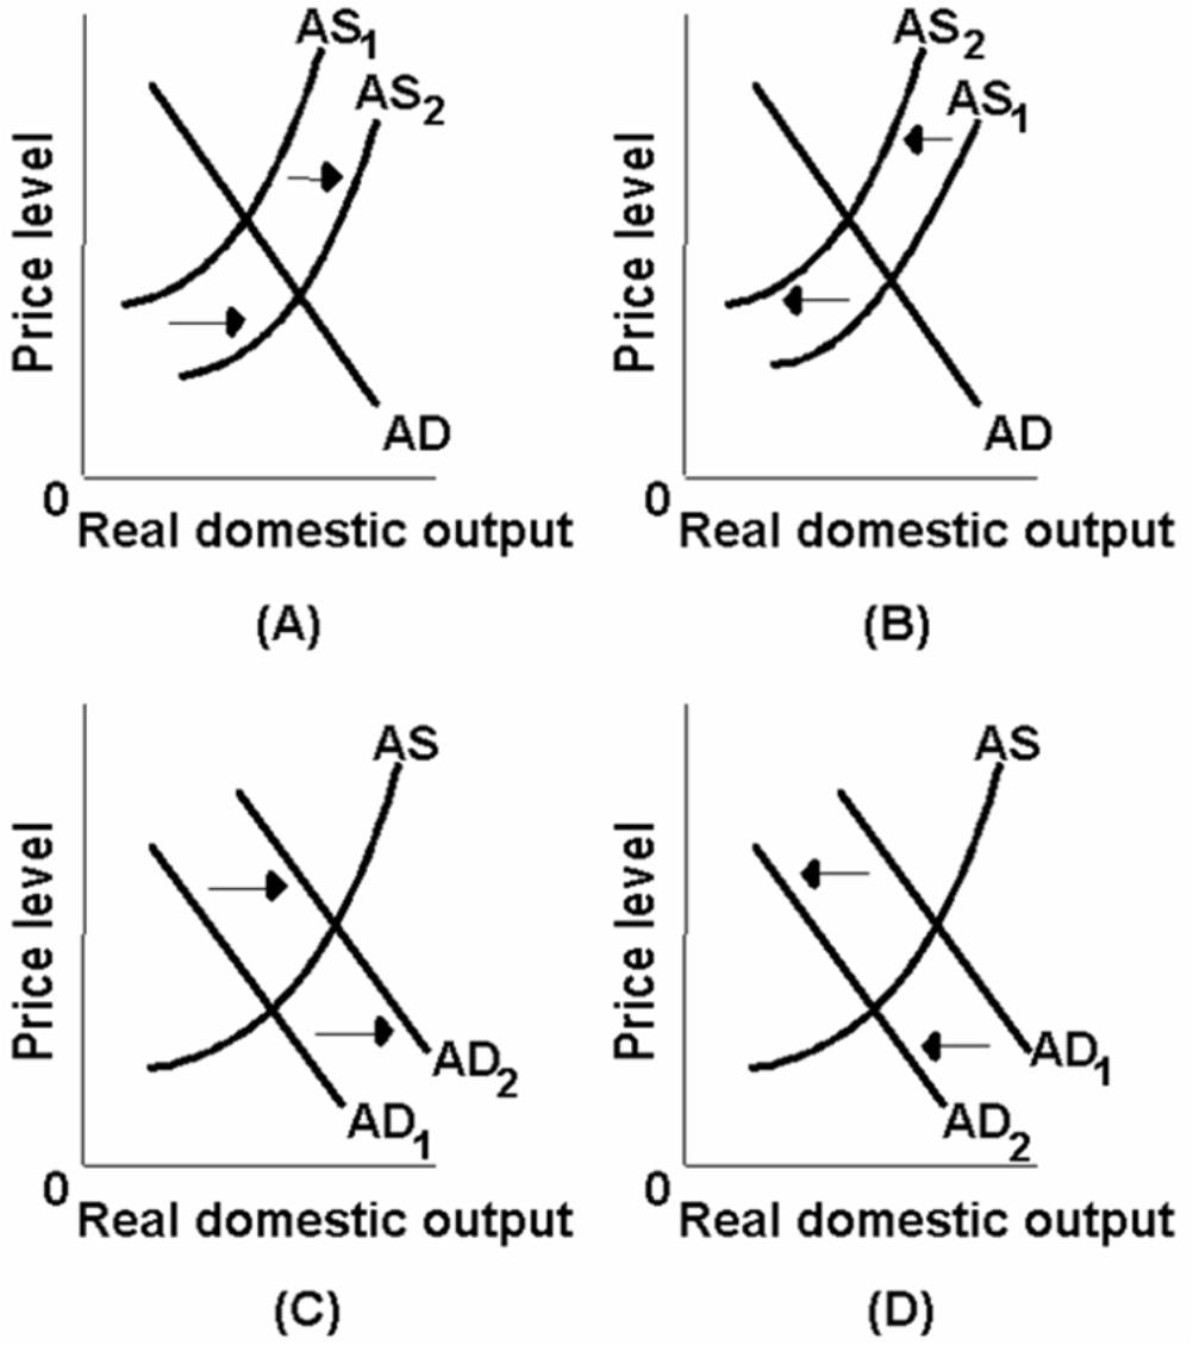 -Which of the above diagrams best portrays the effects of declines in the prices of imported resources?
(Multiple Choice)
4.9/5 (35)
The following table is for a particular country in which C is consumption expenditures,Ig is gross investment expenditures,G is government expenditures,X is exports,and M is imports.All figures are in billions of dollars.Each question is independent of the other questions.
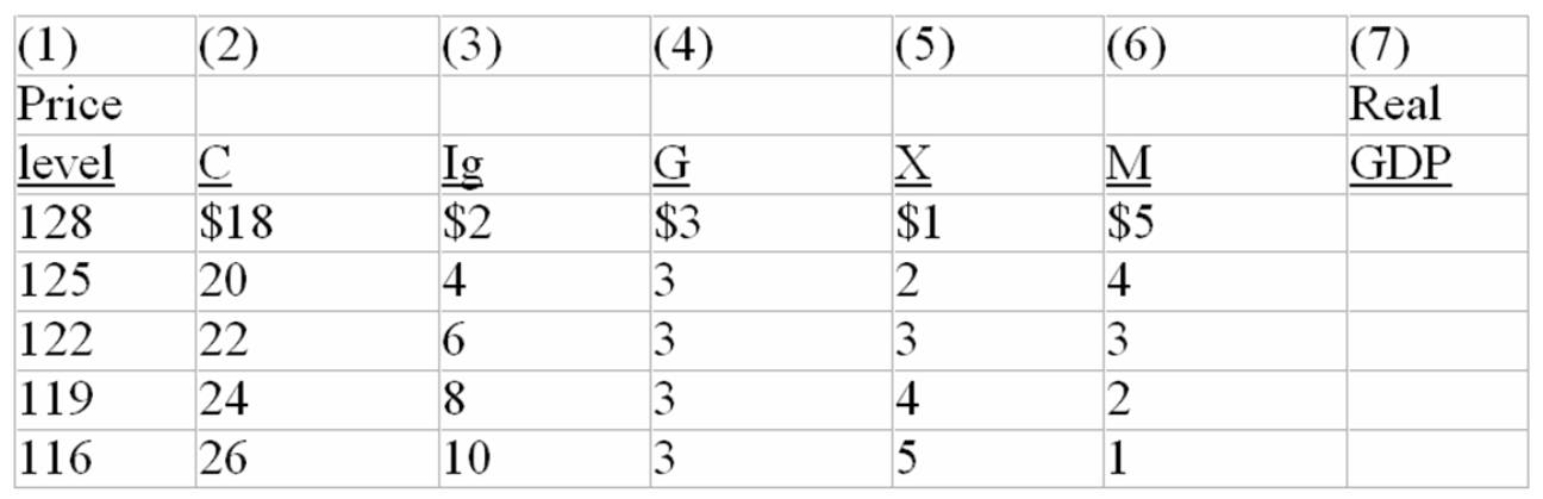 -Refer to the above table.The wealth or real balances effect of changes in the price level is:
(Multiple Choice)
4.7/5 (27)
Filters
- Essay(0)
- Multiple Choice(0)
- Short Answer(0)
- True False(0)
- Matching(0)