Exam 12: Aggregate Demand and Aggregate Supply
Exam 1: Limits, Alternatives, and Choices257 Questions
Exam 2: The Market System and the Circular Flow112 Questions
Exam 3: Demand, Supply, and Market Equilibrium284 Questions
Exam 4: Market Failures: Public Goods and Externalities122 Questions
Exam 5: Governments Role and Government Failure109 Questions
Exam 6: An Introduction to Macroeconomics58 Questions
Exam 7: Measuring the Economys Output181 Questions
Exam 8: Economic Growth112 Questions
Exam 9: Business Cycles, Unemployment, and Inflation184 Questions
Exam 10: Basic Macroeconomic Relationships187 Questions
Exam 11: The Aggregate Expenditures Model230 Questions
Exam 12: Aggregate Demand and Aggregate Supply229 Questions
Exam 13: Fiscal Policy, Deficits, Surpluses, and Debt223 Questions
Exam 14: Money, Banking, and Money Creation203 Questions
Exam 15: Interest Rates and Monetary Policy238 Questions
Exam 16: Long-Run Macroeconomic Adjustments119 Questions
Exam 17: International Trade181 Questions
Exam 18: Exchange Rates and the Balance of Payments127 Questions
Select questions type
How is the short-run aggregate supply curve sloped and why is it sloped this way?
(Essay)
4.9/5  (31)
(31)
Other things being equal,if the national incomes of our major international lending partners were to rise,our:
(Multiple Choice)
5.0/5 (36)
The following table is for a particular country in which C is consumption expenditures,Ig is gross investment expenditures,G is government expenditures,X is exports,and M is imports.All figures are in billions of dollars.
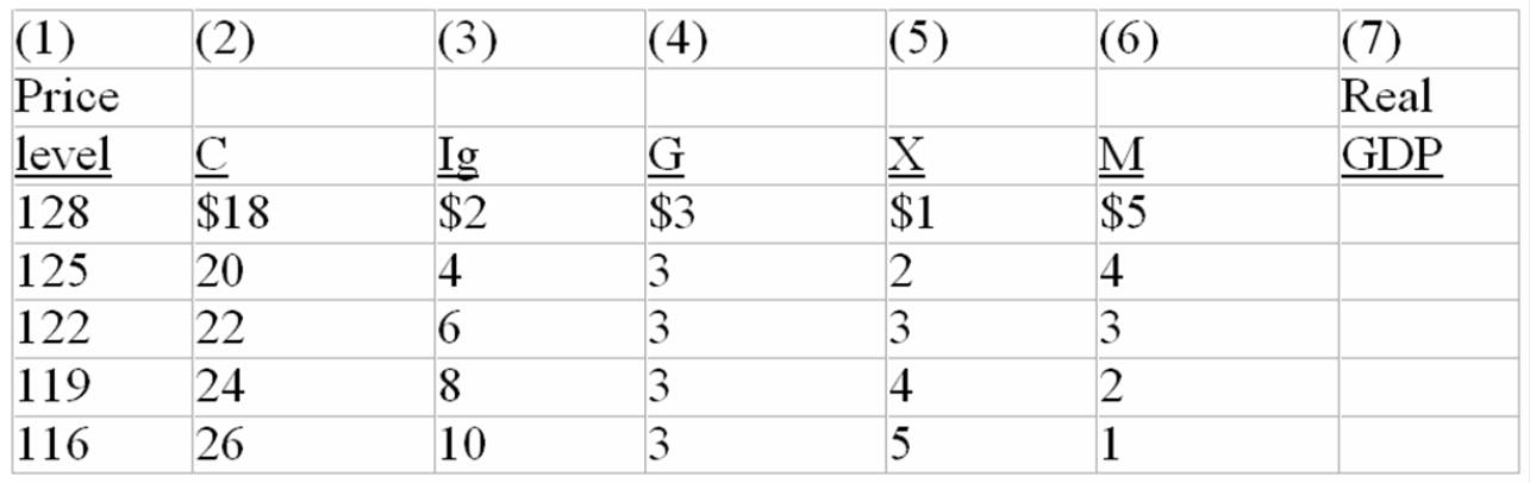 -Refer to the above table.The interest rate effect of changes in the price level is shown by columns:
(Multiple Choice)
4.8/5 (36)
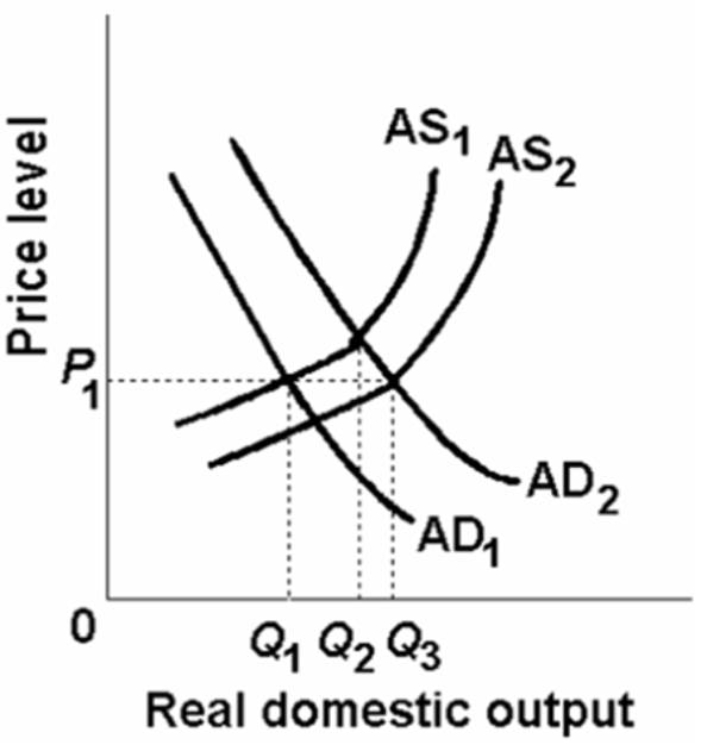 -In the above figure AD1 and AS1 represent the original aggregate supply and demand curves and AD2 and AS2 show the new aggregate demand and supply curves.The change in aggregate supply from AS 1 to AS2 could be caused by:
(Multiple Choice)
4.8/5 (31)
How can the aggregate demand curve be derived from the aggregate expenditures model?
(Essay)
4.7/5 (38)
-In the above figure AD1 and AS1 represent the original aggregate supply and demand curves and AD2 and AS2 show the new aggregate demand and supply curves.The changes in aggregate demand and supply in the above diagram produce:
(Multiple Choice)
4.8/5 (38)
An increase in the price level,other things equal,will shift the:
(Multiple Choice)
4.8/5 (40)
A decrease in aggregate demand is most likely to be caused by:
(Multiple Choice)
4.8/5 (38)
A movement upward along an existing aggregate demand curve that changes the price level is equivalent to a(n):
(Multiple Choice)
4.9/5 (32)
In the below diagram assume that the aggregate demand curve shifts from AD1 in year 1 to AD2 in year 2,only to fall back to AD1 in year 3.
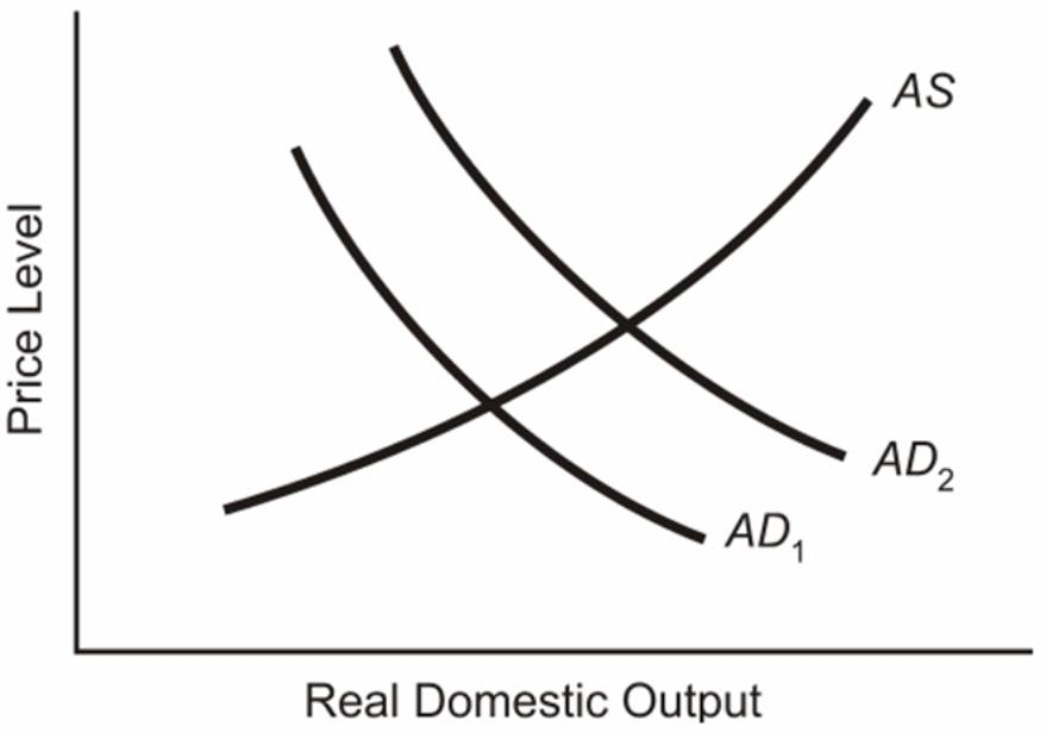 (a)Explain what will happen to the equilibrium price level and the equilibrium level of real GDP from year 1 to year 2.
(b)Locate the new position in year 3 on the assumption that prices and wages are completely flexible downward.Label this position,Pb and GDPb for the price level and real GDP respectively.
(c)Locate the new position in year 3 on the assumption that prices and wages are completely inflexible downward.Label this position,Pc and GDPc for the price level and real GDP respectively.
(a)Explain what will happen to the equilibrium price level and the equilibrium level of real GDP from year 1 to year 2.
(b)Locate the new position in year 3 on the assumption that prices and wages are completely flexible downward.Label this position,Pb and GDPb for the price level and real GDP respectively.
(c)Locate the new position in year 3 on the assumption that prices and wages are completely inflexible downward.Label this position,Pc and GDPc for the price level and real GDP respectively.
(Essay)
4.8/5 (32)
Would increased downward price flexibility lead to less severe or more severe recessions? Explain.
(Essay)
5.0/5 (31)
The following list of items are related to aggregate demand and/or aggregate supply.
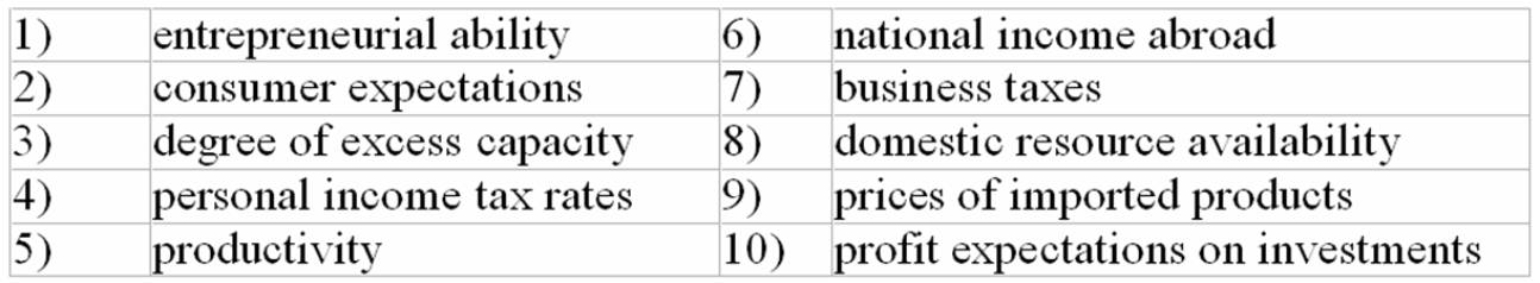 -Refer to the above list.A change in which factor is most likely to change both aggregate demand and aggregate supply?
(Multiple Choice)
4.7/5 (33)
A movement downward along an existing aggregate demand curve is equivalent to a(n):
(Multiple Choice)
4.8/5 (41)
The passage of new legislation requiring more extensive government regulation of business will most likely:
(Multiple Choice)
4.9/5 (38)
Refer to the diagram below.Other things equal,a shift of the aggregate supply curve from AS0 to AS1 might be caused by a(n): 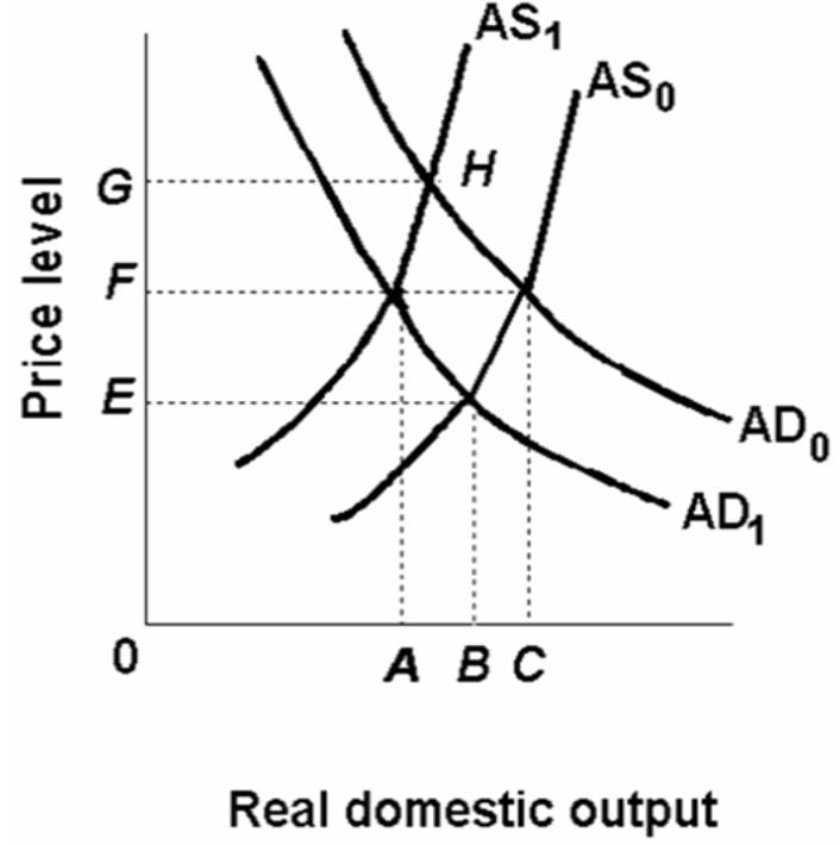
(Multiple Choice)
4.8/5 (29)
Filters
- Essay(0)
- Multiple Choice(0)
- Short Answer(0)
- True False(0)
- Matching(0)