Exam 14: Time-Series Forecasting and Index Numbers
Exam 1: Defining and Collecting Data145 Questions
Exam 2: Organising and Visualising Data203 Questions
Exam 3: Numerical Descriptive Measures147 Questions
Exam 4: Basic Probability168 Questions
Exam 5: Some Important Discrete Probability Distributions172 Questions
Exam 6: The Normal Distribution and Other Continuous Distributions190 Questions
Exam 7: Sampling Distributions133 Questions
Exam 8: Confidence Interval Estimation186 Questions
Exam 9: Fundamentals of Hypothesis Testing: One-Sample Tests180 Questions
Exam 10: Hypothesis Testing: Two-Sample Tests175 Questions
Exam 11: Analysis of Variance148 Questions
Exam 12: Simple Linear Regression207 Questions
Exam 13: Introduction to Multiple Regression269 Questions
Exam 14: Time-Series Forecasting and Index Numbers201 Questions
Exam 15: Chi-Square Tests134 Questions
Exam 16: Multiple Regression Model Building93 Questions
Exam 17: Decision Making106 Questions
Exam 18: Statistical Applications in Quality Management119 Questions
Exam 19: Further Non-Parametric Tests50 Questions
Select questions type
The monthly publication of the quarterly GDP of a country is an example of a(n)_______.
(Short Answer)
4.7/5  (27)
(27)
Instruction 14-9
The president of a chain of department stores believes that her stores' total sales have been showing a linear trend since 1980. She uses Microsoft Excel to obtain the partial output below. The dependent variable is sales (in millions of dollars), while the independent variable is coded years, where 1990 is coded as 0, 1991 is coded as 1, etc.
SUMMAROUIPUT Regression Statistics MultipleR 0.604 R Square 0.365 Adjusted R Square 0.316 standard Error 4.800 Observations 17 Coeflients Intercept 31.2 Coded Year 0.78
-Referring to Instruction 14-9,the forecast for sales (in millions of dollars)in 2010 is _______
(Short Answer)
4.8/5 (31)
Instruction 14-15
The number of train passengers arriving in Adelaide on the Overland on six successive Mondays were: 60, 72, 96, 84, 36 and 48.
-Referring to Instruction 14-15,plot both the number of arrivals series and the series of Holt-Winters forecast for the seventh through twelfth Mondays using a smoothing constant of 0.3 for both level and trend.
(Essay)
4.9/5 (36)
Instruction 14-10
The executive vice president of a drug manufacturing firm believes that the demand for the firm's most popular drug has been evidencing an exponential trend since 1995. She uses Microsoft Excel to obtain the partial output below. The dependent variable is the log base 10 of the demand for the drug, while the independent variable is years, where 1995 is coded as 0, 1996 is coded as 1, etc.
PuMMaression Statistics MultipleR 0.996 R Square 0.992 Adjusted R Square 0.991 Standard Error 0.02831 Observations 12 Coefiients Intercept 1.44 Coded Year 0.068
-Referring to Instruction 14-10,the fitted trend value for 2000 is _______.
(Short Answer)
4.8/5 (39)
The Paasche price index has the disadvantage that current consumption quantities are usually hard to obtain.
(True/False)
4.9/5 (41)
Instruction 14-19
The number of train passengers arriving in Adelaide on the Overland on six successive Mondays were: 60, 72, 96, 84, 36 and 48.
-Referring to Instruction 14-14,the Holt-Winters method for forecasting with smoothing constant of 0.2 for both level and trend will be used to forecast the wine sales.The forecast for 2014 is_______.
(Short Answer)
4.8/5 (41)
Which of the following statements about the method of exponential smoothing is NOT true?
(Multiple Choice)
4.9/5 (36)
The changes in the price of the least consumed commodities are overly influential in a weighted aggregate price index.
(True/False)
4.9/5 (38)
Which of the following methods should not be used for short-term forecasts into the future?
(Multiple Choice)
4.8/5 (35)
After estimating a trend model for annual time-series data,you obtain the following residual plot against time. 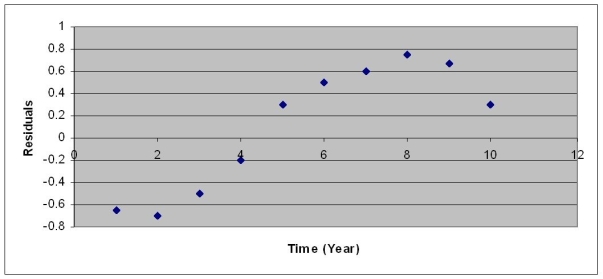 The problem with your model is that
(Multiple Choice)
4.9/5 (31)
Instruction 14-3
The number of cases of merlot wine sold by a Barossa Valley Winery in an eight-year period follows.
Year Coses of Wine 2003 270 2004 356 2005 398 2006 456 2007 358 2008 500 2009 410 2010 376
-Referring to Instruction 14-3,a centred three-year moving average is to be constructed for the wine sales.The moving average for 2004 is _______.
(Short Answer)
4.8/5 (28)
One criticism of time-series forecasting is that it applies mathematical models mechanically to the future.
(True/False)
4.8/5 (29)
Instruction 14-2
The following table contains the number of complaints received in a department store for the first six months of last year.
Month Complaints January 36 February 45 March 81 April 50 May 108 June 144
-Referring to Instruction 14-2,suppose the last two smoothed values are 81 and 96 (Note: They are not).What would you forecast as the value of the time series for September?
(Multiple Choice)
4.8/5 (28)
Instruction 14-10
The executive vice president of a drug manufacturing firm believes that the demand for the firm's most popular drug has been evidencing an exponential trend since 1995. She uses Microsoft Excel to obtain the partial output below. The dependent variable is the log base 10 of the demand for the drug, while the independent variable is years, where 1995 is coded as 0, 1996 is coded as 1, etc.
PuMMaression Statistics MultipleR 0.996 R Square 0.992 Adjusted R Square 0.991 Standard Error 0.02831 Observations 12 Coefiients Intercept 1.44 Coded Year 0.068
-Referring to Instruction 14-10,the fitted trend value for 1995 is _______
(Short Answer)
4.8/5 (37)
The most basic assumption of a time series model for forecasting is that _______.
(Short Answer)
4.8/5 (35)
Instruction 14-19
The number of train passengers arriving in Adelaide on the Overland on six successive Mondays were: 60, 72, 96, 84, 36 and 48.
-Referring to Instruction 14-13,exponentially smooth the number of arrivals using a smoothing constant of 0.1.
(Essay)
4.8/5 (32)
Instruction 14-15
The number of train passengers arriving in Adelaide on the Overland on six successive Mondays were: 60, 72, 96, 84, 36 and 48.
-Referring to Instruction 14-15,the Holt-Winters method for forecasting with smoothing constant of 0.3 for both level and trend will be used to forecast the number of arrivals.The forecast for the twelfth Monday is _______
(Short Answer)
4.9/5 (35)
Instruction 14-21
Given below are the average prices for three types of energy products in Australia from 2006 to 2010.
Year Electricity Natural Gas Fuel Oil 2006 43.205 25.893 0.892 2007 16.959 28.749 0.969 2008 47.202 28.933 1.034 2009 48.874 29.872 0.913 2010 48.693 28.384 0.983
-Referring to Instruction 14-21,what is the Paasche price index for the group of three energy items in 2008 for a family that consumed 13 units of electricity,26 units of natural gas and 235 units of fuel oil in 2008 using 2006 as the base year?
(Short Answer)
4.9/5 (43)
_______methods are primarily based on the subjective opinion of the forecaster rather than the analysis of numerical data.
(Multiple Choice)
4.8/5 (33)
Filters
- Essay(0)
- Multiple Choice(0)
- Short Answer(0)
- True False(0)
- Matching(0)