Exam 10: Aggregate Supply
Exam 1: The Art and Science of Economic Analysis150 Questions
Exam 2: Economic Tools and Economic Systems154 Questions
Exam 3: Economic Decision Makers174 Questions
Exam 4: Demand, supply, and Markets152 Questions
Exam 5: Introduction to Macroeconomics151 Questions
Exam 6: Tracking the Useconomy150 Questions
Exam 7: Unemployment and Inflation150 Questions
Exam 8: Productivity and Growth150 Questions
Exam 9: Aggregate Demand150 Questions
Exam 10: Aggregate Supply150 Questions
Exam 11: Fiscal Policy149 Questions
Exam 12: Federal Budgets and Public Policy153 Questions
Exam 13: Money and the Financial System150 Questions
Exam 14: Banking and the Money Supply150 Questions
Exam 15: Monetary Theory and Policy150 Questions
Exam 16: Macro Policy Debate: Active or Passive150 Questions
Exam 17: International Trade150 Questions
Exam 18: International Finance150 Questions
Exam 19: Economic Development150 Questions
Select questions type
For the aggregate demand and aggregate supply listed in schedule #3 of the table given below,the equilibrium output level and price level are:
Table 10.1
Quantity of
Aggregate Output
Demanded
Price
Level
Quantity of
Aggregate Output Supplied
#1
#2
#3
$7)0
110
$5)0
$6)0
$4)0
6)5
120
5)5
6)5
4)5
6)0
130
6)0
7)0
5)0
5)5
140
6)5
7)5
5)5
5)0
150
7)0
8)0
6)0
(Multiple Choice)
4.8/5  (32)
(32)
The main effect of a decrease in the stock of capital is a(n):
(Multiple Choice)
4.8/5 (32)
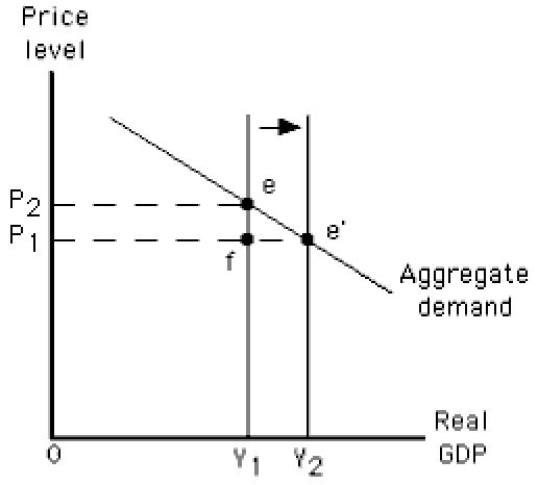
The figure given below depicts long run equilibrium in an aggregate demand-aggregate supply model.The change in real GDP in this figure from Y1 to Y2 could have been caused by:
Figure 10.8
(Multiple Choice)
4.8/5 (39)
In 2009,actual output in the U.S.was 4.7 percent below the potential output.This implies that the:
(Multiple Choice)
4.8/5 (38)
In constructing the short-run aggregate supply curve,we define the short run as the period in which:
(Multiple Choice)
4.7/5 (30)
Given implicit or explicit resource price agreements,if the actual price level is below the expected price level,the:
(Multiple Choice)
4.8/5 (36)
Which of the following is true in the short run but not in the long run?
(Multiple Choice)
4.9/5 (40)
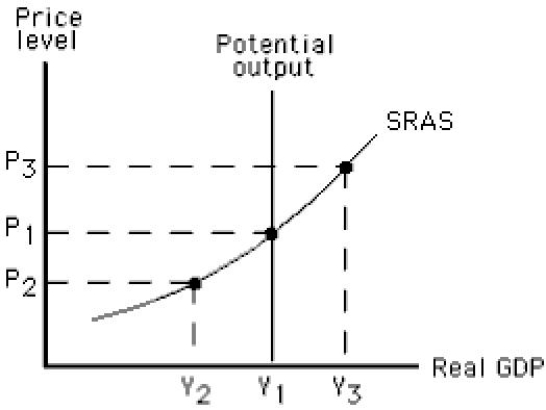
The figure below shows the short-run aggregate supply curve of an economy.In this figure,an expansionary gap would be represented by the distance between:
Figure 10.1
(Multiple Choice)
4.8/5 (32)
Suppose the actual and expected price levels in an economy are initially equal.However,the actual price level becomes higher due to some change in economic conditions.Which of the following will occur eventually?
(Multiple Choice)
4.7/5 (39)
For the aggregate demand and aggregate supply listed in schedule #2 of the table given below,the equilibrium output level and price level are:
Table 10.1
Quantity of
Aggregate Output
Demanded
Price
Level
Quantity of
Aggregate Output Supplied
#1
#2
#3
$7)0
110
$5)0
$6)0
$4)0
6)5
120
5)5
6)5
4)5
6)0
130
6)0
7)0
5)0
5)5
140
6)5
7)5
5)5
5)0
150
7)0
8)0
6)0
(Multiple Choice)
5.0/5 (39)
Which of the following changes best represents the effect of the oil embargo (a shut-off of oil from certain OPEC countries)of the 1970s on the U.S.?
(Multiple Choice)
4.8/5 (37)
An increase in the federal minimum wage will shift the long-run aggregate supply curve to the left.
(True/False)
4.7/5 (38)
If the rate of increase in the price level exceeds the rate of increase in nominal GDP,real GDP declines.
(True/False)
4.9/5 (37)
If the actual price level is lower than the expected price level,the economy will contract in the short run.
(True/False)
4.8/5 (34)
Which of these is not assumed to be constant along a short-run aggregate supply curve?
(Multiple Choice)
4.8/5 (34)
In the long run,the price level in an economy is determined solely by:
(Multiple Choice)
4.9/5 (35)
Which of the following is most likely to increase long-run aggregate supply in an economy?
(Multiple Choice)
4.9/5 (34)
Filters
- Essay(0)
- Multiple Choice(0)
- Short Answer(0)
- True False(0)
- Matching(0)