Exam 10: Aggregate Supply
Exam 1: The Art and Science of Economic Analysis150 Questions
Exam 2: Economic Tools and Economic Systems154 Questions
Exam 3: Economic Decision Makers174 Questions
Exam 4: Demand, supply, and Markets152 Questions
Exam 5: Introduction to Macroeconomics151 Questions
Exam 6: Tracking the Useconomy150 Questions
Exam 7: Unemployment and Inflation150 Questions
Exam 8: Productivity and Growth150 Questions
Exam 9: Aggregate Demand150 Questions
Exam 10: Aggregate Supply150 Questions
Exam 11: Fiscal Policy149 Questions
Exam 12: Federal Budgets and Public Policy153 Questions
Exam 13: Money and the Financial System150 Questions
Exam 14: Banking and the Money Supply150 Questions
Exam 15: Monetary Theory and Policy150 Questions
Exam 16: Macro Policy Debate: Active or Passive150 Questions
Exam 17: International Trade150 Questions
Exam 18: International Finance150 Questions
Exam 19: Economic Development150 Questions
Select questions type
If the actual price level is less than the expected price level reflected in long-term contracts,_____.
(Multiple Choice)
4.8/5  (37)
(37)
If resource prices are flexible,the long-run aggregate supply curve is vertical.
(True/False)
4.8/5 (36)
A recessionary gap is usually closed in the long run by a(n):
(Multiple Choice)
4.9/5 (36)
If global pollution causes climatic changes that permanently harm crop production worldwide,aggregate supply and demand analysis would lead us to expect:
(Multiple Choice)
4.7/5 (36)
If nominal wage rates increase by 5 percent per year and the price level increases by 3 percent per year,which of the following is correct?
(Multiple Choice)
4.9/5 (41)
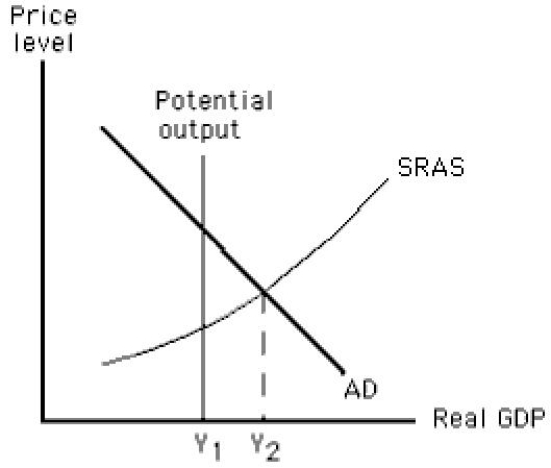
The figure below shows the short-run aggregate demand and supply curves of an economy.When real GDP is at Y2,_____.
Figure 10.2

(Multiple Choice)
4.8/5 (33)
Which of the following if true would suggest that an expansionary gap exists in an economy?
(Multiple Choice)
4.8/5 (25)
When the economy produces its potential output,_____ is zero.
(Multiple Choice)
4.8/5 (37)
The slope of the short-run aggregate supply curve depends on how sharply:
(Multiple Choice)
4.8/5 (34)
Suppose the real wage of a worker remains unchanged between Year 1 and Year 2 but the nominal wage decreases from $20 in Year 1 to $18 in Year 2.This implies that the price level has:
(Multiple Choice)
4.9/5 (35)
The short-run equilibrium output in the economy described by the figure given below is Y1.
(True/False)
4.8/5 (41)
The figure given below depicts long-run equilibrium in the aggregate demand-aggregate supply model.Which of the following changes is depicted by the movement from Y1 to Y2?
Figure 10.9
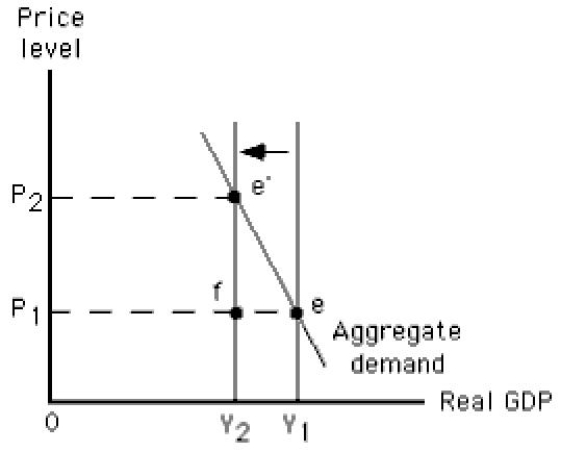
(Multiple Choice)
4.8/5 (38)
In the figure given below,when aggregate supply is AS,the equilibrium output and price level will be Y2 and P2.
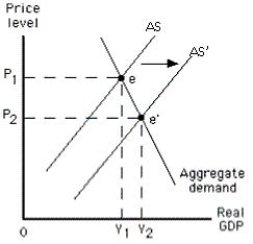
(True/False)
4.9/5 (37)
Which of the following is true of a beneficial supply shock?
(Multiple Choice)
4.9/5 (28)
The figure below shows the short-run aggregate demand and supply curves of an economy.If the economy is currently producing at Y2,long-run equilibrium will most likely be established by a(n):
Figure 10.2

(Multiple Choice)
4.8/5 (30)
Suppose the real wage remains unchanged between Year 1 and Year 2 but the nominal wage increases from $20 to $24.Based on this information,we can conclude that the price level has:
(Multiple Choice)
4.8/5 (37)
Filters
- Essay(0)
- Multiple Choice(0)
- Short Answer(0)
- True False(0)
- Matching(0)