Exam 10: Aggregate Supply
Exam 1: The Art and Science of Economic Analysis150 Questions
Exam 2: Economic Tools and Economic Systems154 Questions
Exam 3: Economic Decision Makers174 Questions
Exam 4: Demand, supply, and Markets152 Questions
Exam 5: Introduction to Macroeconomics151 Questions
Exam 6: Tracking the Useconomy150 Questions
Exam 7: Unemployment and Inflation150 Questions
Exam 8: Productivity and Growth150 Questions
Exam 9: Aggregate Demand150 Questions
Exam 10: Aggregate Supply150 Questions
Exam 11: Fiscal Policy149 Questions
Exam 12: Federal Budgets and Public Policy153 Questions
Exam 13: Money and the Financial System150 Questions
Exam 14: Banking and the Money Supply150 Questions
Exam 15: Monetary Theory and Policy150 Questions
Exam 16: Macro Policy Debate: Active or Passive150 Questions
Exam 17: International Trade150 Questions
Exam 18: International Finance150 Questions
Exam 19: Economic Development150 Questions
Select questions type
The international oil price hike by OPEC was an adverse supply shock faced by the U.S.in the 1970s.
(True/False)
4.9/5  (37)
(37)
The nominal cost per unit of output rises when production is pushed beyond an economy's potential output.
(True/False)
4.8/5 (39)
In the long run,a leftward shift of the aggregate demand curve will lead to a(n):
(Multiple Choice)
4.8/5 (30)
The figure below shows the short-run aggregate supply curve of an economy.In this figure,if P1 is the price level prevailing in the economy,it implies that:
Figure 10.1
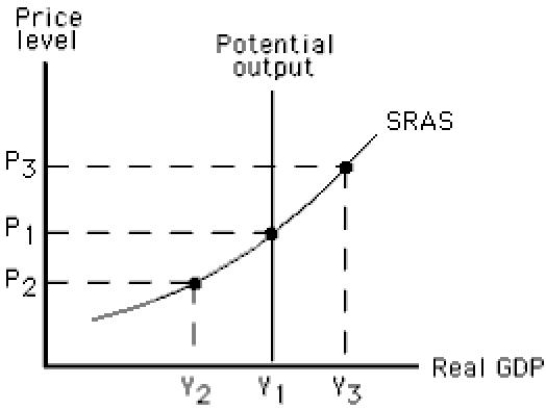
(Multiple Choice)
4.8/5 (41)
The longer the unemployment rate remains above the natural rate,the higher the natural rate.This theory is known as historical analysis.
(True/False)
4.8/5 (37)
The figure below shows short-run equilibrium in an aggregate demand-aggregate supply model.If the economy is currently producing Y1 level of output,_____.
Figure 10.5
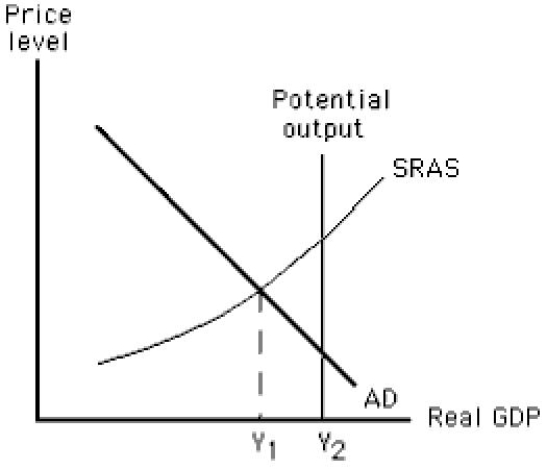
(Multiple Choice)
4.8/5 (38)
The actual price level is assumed to be constant along a given short-run aggregate supply curve.
(True/False)
4.8/5 (37)
When resource prices are negotiable,the long-run aggregate supply curve is represented by:
(Multiple Choice)
4.9/5 (42)
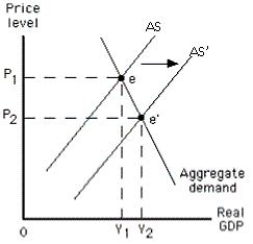
The figure below shows equilibrium in an aggregate demand-aggregate supply model.In this figure,the shift from AS to AS' is likely to occur when:
Figure 10.3
(Multiple Choice)
4.9/5 (36)
Which of the following supply shocks would shift the aggregate supply curve inward?
(Multiple Choice)
4.8/5 (35)
The figure below shows equilibrium in an aggregate demand-aggregate supply model.Which of these situations will be experienced by the economy as it moves from point e to point e'?
Figure 10.3

(Multiple Choice)
4.8/5 (41)
If the price level in an economy turns out to be higher than that expected by workers and firms,_____.
(Multiple Choice)
4.9/5 (28)
An adverse supply shock generally decreases the price level and the real GDP.
(True/False)
4.8/5 (36)
During a particular year,nominal wages increased by 4 percent but real wages declined by 2 percent.This implies that the price level increased by 6 percent.
(True/False)
4.8/5 (30)
As actual output falls below the potential level in the short run,which of the following is most likely to occur?
(Multiple Choice)
5.0/5 (34)
Filters
- Essay(0)
- Multiple Choice(0)
- Short Answer(0)
- True False(0)
- Matching(0)