Exam 10: Aggregate Supply
Exam 1: The Art and Science of Economic Analysis150 Questions
Exam 2: Economic Tools and Economic Systems154 Questions
Exam 3: Economic Decision Makers174 Questions
Exam 4: Demand, supply, and Markets152 Questions
Exam 5: Introduction to Macroeconomics151 Questions
Exam 6: Tracking the Useconomy150 Questions
Exam 7: Unemployment and Inflation150 Questions
Exam 8: Productivity and Growth150 Questions
Exam 9: Aggregate Demand150 Questions
Exam 10: Aggregate Supply150 Questions
Exam 11: Fiscal Policy149 Questions
Exam 12: Federal Budgets and Public Policy153 Questions
Exam 13: Money and the Financial System150 Questions
Exam 14: Banking and the Money Supply150 Questions
Exam 15: Monetary Theory and Policy150 Questions
Exam 16: Macro Policy Debate: Active or Passive150 Questions
Exam 17: International Trade150 Questions
Exam 18: International Finance150 Questions
Exam 19: Economic Development150 Questions
Select questions type
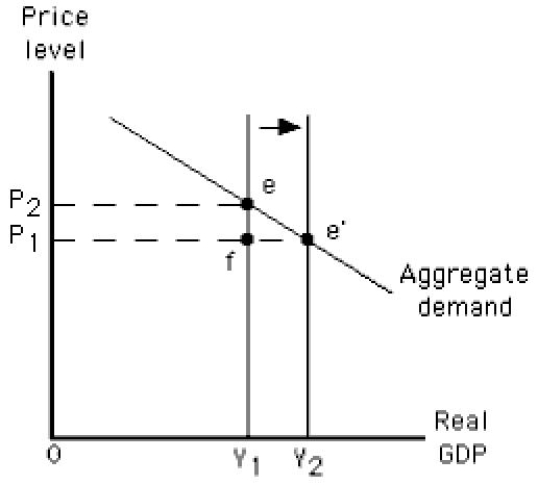
The figure given below depicts long run equilibrium in an aggregate demand-aggregate supply model.Which of these could have caused the movement shown in this figure?
Figure 10.8
(Multiple Choice)
4.7/5  (41)
(41)
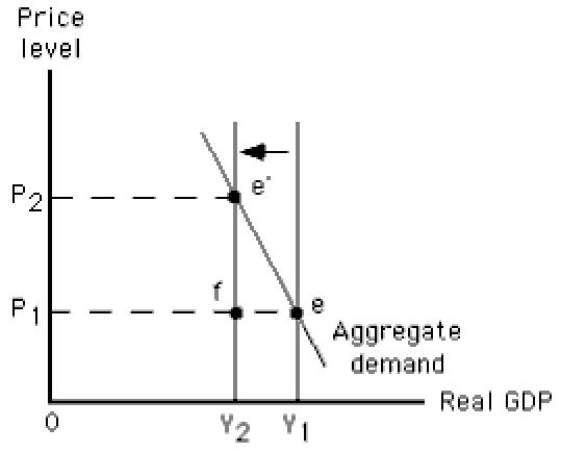
The figure given below depicts long-run equilibrium in the aggregate demand-aggregate supply model.The movement from Y1 to Y2in this figure could have been caused by a:
Figure 10.9
(Multiple Choice)
4.9/5 (33)
Actual output can exceed the economy's potential both in the short run and the long run.
(True/False)
5.0/5 (34)
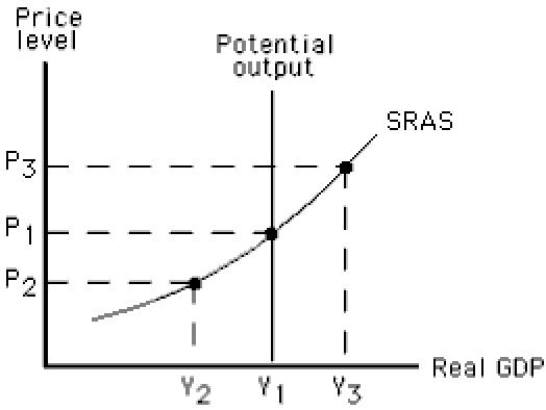
The figure below shows the short-run aggregate supply curve of an economy.If P3 is the price level prevailing in the economy,_____.
Figure 10.1
(Multiple Choice)
4.7/5 (32)
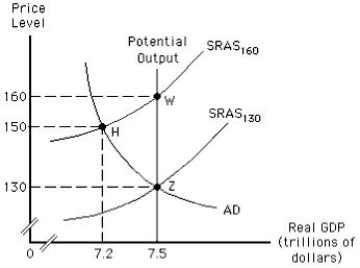
The figure below shows the determination of the equilibrium price level and real GDP in an aggregate demand-aggregate supply model.If the economy is at point H,there is a(n):
Figure 10.7
(Multiple Choice)
4.8/5 (36)
The potential output of an economy is the level of output produced when the:
(Multiple Choice)
4.7/5 (29)
The fact that some resource prices are fixed by contracts help explain why firms:
(Multiple Choice)
4.9/5 (34)
In the aggregate demand-aggregate supply model,which of these changes is most likely when the cost of production increases in the long run?
(Multiple Choice)
4.7/5 (41)
In the long run,a decrease in aggregate demand will lead to a(n):
(Multiple Choice)
4.8/5 (27)
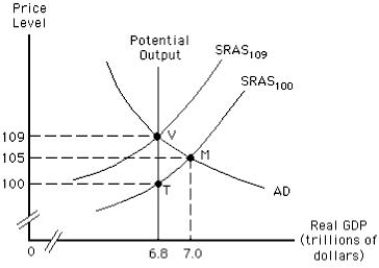
The figure below shows the equilibrium in an aggregate demand-aggregate supply model.In this figure,which of the following is true for an economy that is at point V in the short run?
Figure 10.4
(Multiple Choice)
4.7/5 (35)
Which of these does not hold true if an economy is simultaneously in long-run and short-run equilibrium?
(Multiple Choice)
5.0/5 (31)
Which of these is most likely to reduce the potential output of an economy?
(Multiple Choice)
4.8/5 (33)
Which of these is true of the expected price level in a labor market?
(Multiple Choice)
4.9/5 (36)
Floods in the Midwest that diminish farm output would shift the aggregate supply curve outward.
(True/False)
5.0/5 (42)
If resource suppliers and demanders find out that the actual price level exceeds the expected price level,they will take corrective actions that will:
(Multiple Choice)
5.0/5 (28)
When the actual price level in an economy turns out to be lower than that expected in the short run,_____.
(Multiple Choice)
4.8/5 (33)
Filters
- Essay(0)
- Multiple Choice(0)
- Short Answer(0)
- True False(0)
- Matching(0)