Exam 22: Exchange Rates and Financial Links Between Countries
Exam 1: The Wealth of Nations: Ownership and Economic Freedom87 Questions
Exam 2: Scarcity and Opportunity Costs87 Questions
Exam 3: Markets and the Price System96 Questions
Exam 4: The Aggregate Economy61 Questions
Exam 5: Using Economics to Understand the World Around You68 Questions
Exam 6: Elasticity: Demand and Supply133 Questions
Exam 7: Demand: Consumer Choice142 Questions
Exam 8: Supply: the Costs of Doing Business105 Questions
Exam 9: Profit Maximization121 Questions
Exam 10: Perfect Competition135 Questions
Exam 11: Monopoly118 Questions
Exam 12: Monopolistic Competition and Oligopoly114 Questions
Exam 13: Markets and Government113 Questions
Exam 14: Antitrust and Regulation88 Questions
Exam 15: Resource Markets110 Questions
Exam 16: The Labor Market116 Questions
Exam 17: The Capital Market110 Questions
Exam 18: The Land Market and Natural Resources55 Questions
Exam 19: Current Issues: Income, Income Distribution, Poverty, and Government Policy85 Questions
Exam 20: World Trade Equilibrium112 Questions
Exam 21: International Trade Restrictions109 Questions
Exam 22: Exchange Rates and Financial Links Between Countries130 Questions
Select questions type
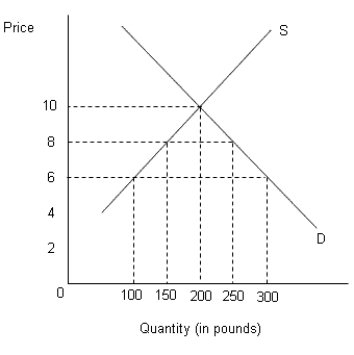
The figure below shows the demand (D) and supply (S) curves of cocoa in the U.S.Figure 21.4
 -In effect, during the period immediately following World War II, the world was on a(n):
(Multiple Choice)
4.8/5  (32)
(32)
The figure below shows the demand (D) and supply (S) curves of cocoa in the U.S.Figure 21.4
-The Bretton Woods system required countries to actively buy and sell dollars to maintain fixed exchange rates when:
(Multiple Choice)
4.8/5 (38)
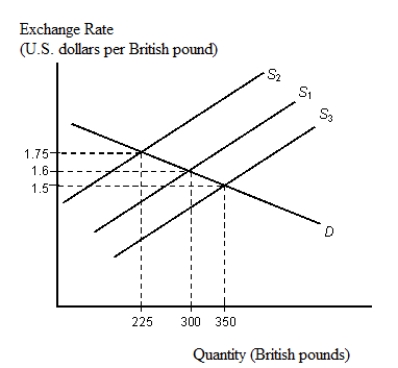
The figure given below depicts the foreign exchange market for British pounds traded for U.S. dollars.Figure 22.2
 -Under a floating exchange-rate system, a country needs to pay more attention to the economic policies of the rest of the world.
(True/False)
4.8/5 (31)
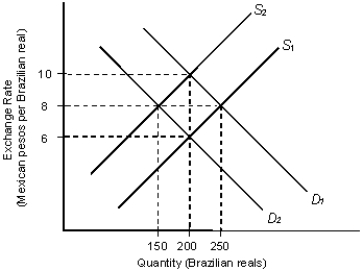
The figure given below depicts the demand and supply of Brazilian reals in the foreign exchange market. Assume that the market operates under a flexible exchange rate regime.Figure 22.1
In the figure:
D1 and D2: Demand for Brazilian reals
S1 and S2: Supply of Brazilian reals
 -Suppose you observe that with a given supply curve, the Peruvian demand for Argentinean pesos steadily decreases. This will most likely mean:
(Multiple Choice)
4.8/5 (39)
The figure below shows the demand (D) and supply (S) curves of cocoa in the U.S.Figure 21.4
-The gold standard ended with the:
(Multiple Choice)
4.8/5 (45)
The figure below shows the demand (D) and supply (S) curves of cocoa in the U.S.Figure 21.4
-Which of the following was the reserve currency under the gold exchange standard?
(Multiple Choice)
4.9/5 (32)
The figure given below depicts the foreign exchange market for British pounds traded for U.S. dollars.Figure 22.2
-An increase in the demand for rubles causes the ruble to appreciate.
(True/False)
4.7/5 (39)
The figure given below depicts the foreign exchange market for British pounds traded for U.S. dollars.Figure 22.2
-If interest rates in Europe fall below interest rates in the United States, then, other things equal, the demand for euros will decrease.
(True/False)
4.9/5 (42)
The figure below shows the demand (D) and supply (S) curves of cocoa in the U.S.Figure 21.4
-Which of the following statements concerning the International Monetary Fund is true?
(Multiple Choice)
4.8/5 (42)
The figure given below depicts the foreign exchange market for British pounds traded for U.S. dollars.Figure 22.2
-Currency speculators are traders who seek to profit from a(n):
(Multiple Choice)
4.8/5 (39)
The figure given below depicts the demand and supply of Brazilian reals in the foreign exchange market. Assume that the market operates under a flexible exchange rate regime.Figure 22.1
In the figure:
D1 and D2: Demand for Brazilian reals
S1 and S2: Supply of Brazilian reals
-Refer to Figure 22.1. Determine the equilibrium exchange rate and equilibrium quantity of Brazilian reals, if D1 and S1 are the relevant demand and supply curves for Brazilian reals in this market.
(Multiple Choice)
4.8/5 (40)
The figure given below depicts the foreign exchange market for British pounds traded for U.S. dollars.Figure 22.2
-When the exchange rate moves from $1 = CAD1.5 to $1 = CAD1.66, it implies:
(Multiple Choice)
4.9/5 (37)
The figure below shows the demand (D) and supply (S) curves of cocoa in the U.S.Figure 21.4
-An upward-sloping supply curve of Korean won in terms of Canadian dollars indicates that:
(Multiple Choice)
4.8/5 (30)
The figure below shows the demand (D) and supply (S) curves of cocoa in the U.S.Figure 21.4
-Suppose the price of an ounce of silver is 100 nuevos soles in Peru and $400 in the United States. This implies:
(Multiple Choice)
4.9/5 (41)
The figure given below depicts the foreign exchange market for British pounds traded for U.S. dollars.Figure 22.2
-The dollar return on a foreign investment is less than the interest rate on the foreign asset, if the foreign currency depreciates against the U.S. dollar between the purchase date and the maturity date.
(True/False)
4.9/5 (40)
The figure given below depicts the foreign exchange market for British pounds traded for U.S. dollars.Figure 22.2
-World Bank funds are largely acquired through interest earned on the deposits of member nations.
(True/False)
4.8/5 (27)
The figure given below depicts the foreign exchange market for British pounds traded for U.S. dollars.Figure 22.2
-Interest rate parity can be summarized by which of the following equilibrium conditions?
(Multiple Choice)
4.8/5 (43)
The figure below shows the demand (D) and supply (S) curves of cocoa in the U.S.Figure 21.4
-Assume that you have just returned to the United States from a summer vacation in Russia, where you exchanged American dollars for Russian rubles. Your economic actions can be said to have:
(Multiple Choice)
4.8/5 (40)
The figure below shows the demand (D) and supply (S) curves of cocoa in the U.S.Figure 21.4
-Which of the following can be categorized as a commodity money standard?
(Multiple Choice)
4.9/5 (39)
The figure below shows the demand (D) and supply (S) curves of cocoa in the U.S.Figure 21.4
-A reserve currency is a currency that is:
(Multiple Choice)
4.8/5 (35)
Filters
- Essay(0)
- Multiple Choice(0)
- Short Answer(0)
- True False(0)
- Matching(0)