Exam 3: Descriptive Statistics
Exam 1: Introduction to Statistics79 Questions
Exam 2: Charts and Graphs75 Questions
Exam 3: Descriptive Statistics63 Questions
Exam 4: Probability72 Questions
Exam 5: Discrete Distributions80 Questions
Exam 6: Continuous Distributions78 Questions
Exam 7: Sampling and Sampling Distributions76 Questions
Exam 8: Statistical Inference: Estimation for Single Populations80 Questions
Exam 9: Statistical Inference: Hypothesis Testing for Single Populations79 Questions
Exam 10: Statistical Inferences About Two Populations70 Questions
Exam 11: Analysis of Variance and Design of Experiments80 Questions
Exam 12: Simple Regression Analysis and Correlation84 Questions
Exam 13: Multiple Regression Analysis80 Questions
Exam 14: Building Multiple Regression Models80 Questions
Exam 15: Time-Series Forecasting and Index Numbers77 Questions
Exam 16: Analysis of Categorical Data76 Questions
Exam 17: Nonparametric Statistics81 Questions
Exam 18: Statistical Quality Control68 Questions
Exam 19: Decision Analysis78 Questions
Select questions type
A commuter travels many kilometres to work each morning.She has timed this trip 5 times during the last month.The time (in minutes)required to make this trip was 34,39,41,35,and 41.The median time (in minutes)required for this trip was ___.
(Multiple Choice)
4.8/5  (39)
(39)
If the mean of a distribution is greater than the median,then the distribution is positively skewed.
(True/False)
4.8/5 (44)
Apply various measures of variability-including the range,interquartile range,mean absolute deviation,variance,and standard deviation (using the empirical rule and Chebyshev's theorem)-to a set of ungrouped data.
(Essay)
4.8/5 (43)
Use computer packages to compute various measures of central tendency,variation,and shape on a set of data,as well as to describe the data distribution graphically.
(Essay)
4.8/5 (29)
A box and whisker plot is determined from the mean,the smallest and the largest values,and the lower and upper quartile.
(True/False)
4.9/5 (31)
A commuter travels many kilometres to work each morning.She has timed this trip 5 times during the last month.The time (in minutes)required to make this trip was 44,39,41,35,and 41.The mean time required for this trip was 40 minutes.What is the standard deviation for this sample data?
(Multiple Choice)
4.9/5 (38)
An instructor is evaluating the performance of students on a test.He records the number of points that each student missed and created a frequency distribution.This is provided below: 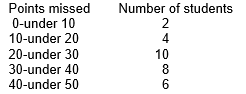 What is the standard deviation for this population?
(Multiple Choice)
4.8/5 (34)
Jessica Salas,president of Salas Products,is reviewing the warranty policy for her company's new model of automobile batteries.Life tests performed on a sample of 100 batteries indicated: (1)an average life of 75 months, (2)a standard deviation of 5 months,and (3)a bell shaped battery life distribution.Approximately 95% of the batteries will last between ___.
(Multiple Choice)
4.9/5 (40)
A statistics student made the following grades on 5 tests: 84,78,88,78,and 82.What is the mode?
(Multiple Choice)
4.8/5 (39)
The following box-and-whisker plot was constructed for the age of accounts receivable: 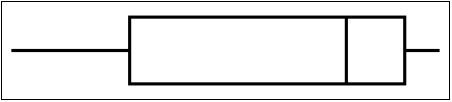 The box-and-whisker plot reveals that the accounts receivable ages are ___.
(Multiple Choice)
4.8/5 (39)
The number of standard deviations that a value (x)is above or below the mean is the ___.
(Multiple Choice)
4.8/5 (28)
The following box-and-whisker plot was constructed for the age of accounts receivable: 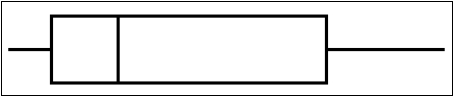 The box-and-whisker plot reveals that the accounts receivable ages are ___.
(Multiple Choice)
4.9/5 (31)
Jessica Salas,president of Salas Products,is reviewing the warranty policy for her company's new model of automobile batteries.Life tests performed on a sample of 100 batteries indicated: (1)an average life of 75 months, (2)a standard deviation of 5 months,and (3)a bell shaped battery life distribution.Approximately 68% of the batteries will last between ___.
(Multiple Choice)
4.9/5 (33)
The following frequency distribution was constructed for the age of accounts receivable: 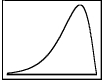 The frequency distribution reveals that the accounts receivable ages are ___.
(Multiple Choice)
4.8/5 (34)
The middle value in an ordered array of numbers is called the mode.
(True/False)
4.8/5 (36)
The ages of students in a class have been put into the frequency distribution below:
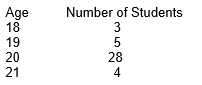 What is the average age of these students?
(Multiple Choice)
4.9/5 (35)
The sum of deviations about the arithmetic mean is always equal to zero.
(True/False)
4.9/5 (39)
The ages of students in a class have been put into the frequency distribution below:
What is the standard deviation for this (population)set of data?
(Multiple Choice)
4.7/5 (35)
It is inappropriate to use the mean to analyze data that are not at least interval level in measurement.
(True/False)
4.9/5 (29)
Describe a data distribution statistically and graphically using skewness,kurtosis,and box-and-whisker plots.
(Essay)
4.8/5 (41)
Filters
- Essay(0)
- Multiple Choice(0)
- Short Answer(0)
- True False(0)
- Matching(0)