Exam 18: Statistical Quality Control
Exam 1: Introduction to Statistics79 Questions
Exam 2: Charts and Graphs75 Questions
Exam 3: Descriptive Statistics63 Questions
Exam 4: Probability72 Questions
Exam 5: Discrete Distributions80 Questions
Exam 6: Continuous Distributions78 Questions
Exam 7: Sampling and Sampling Distributions76 Questions
Exam 8: Statistical Inference: Estimation for Single Populations80 Questions
Exam 9: Statistical Inference: Hypothesis Testing for Single Populations79 Questions
Exam 10: Statistical Inferences About Two Populations70 Questions
Exam 11: Analysis of Variance and Design of Experiments80 Questions
Exam 12: Simple Regression Analysis and Correlation84 Questions
Exam 13: Multiple Regression Analysis80 Questions
Exam 14: Building Multiple Regression Models80 Questions
Exam 15: Time-Series Forecasting and Index Numbers77 Questions
Exam 16: Analysis of Categorical Data76 Questions
Exam 17: Nonparametric Statistics81 Questions
Exam 18: Statistical Quality Control68 Questions
Exam 19: Decision Analysis78 Questions
Select questions type
An chart is being developed using 25 samples of size 8 each.The average of 25 sample means is 6.20.The average of the 25 ranges is 0.30.The upper control limit is ___.
(Multiple Choice)
4.8/5  (30)
(30)
If no variations occurred between manufactured items,the resulting control charts would be excellent.
(True/False)
4.8/5 (33)
Nels Neugent,Purchasing Manager at Pacific Medical Center,is designing a p chart to monitor the proportion of defective purchase orders issued at Pacific.He has the proportions defective for 22 samples of purchase orders.Each sample contained 150 purchase orders,and the average proportion defective is 0.08.The centerline for Nels's p chart is ___.
(Multiple Choice)
4.8/5 (38)
Measure variation among manufactured items using various control charts,including x charts,R charts,p charts,and c charts.
(Essay)
4.9/5 (33)
A lower fat content in meat means higher quality to many consumers.Among Garvin's five quality types,this is an example of ___.
(Multiple Choice)
4.8/5 (38)
According to the following Pareto chart,the most common defect was ___. 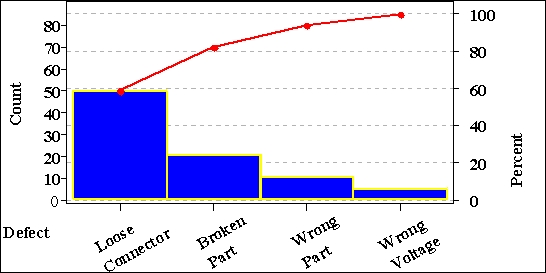
(Multiple Choice)
4.8/5 (25)
Nels Neugent,Purchasing Manager at Pacific Medical Center,is designing a c chart to monitor the number of nonconformances per purchase order issued at Pacific.The total number of nonconformances for 30 purchase orders is 45.The upper control limit for Nels's c chart is ___.
(Multiple Choice)
4.8/5 (38)
A scatter diagram is a graphical mechanism for examining the relationship between two variables.
(True/False)
4.9/5 (35)
Control charts are used to examine the output of a process for disturbing patterns or for data points that indicate that the process is out-of-control.
(True/False)
4.9/5 (34)
Measuring product attributes at regular intervals throughout the manufacturing process in an effort to pinpoint problem areas is called in-process quality control.
(True/False)
4.8/5 (35)
An R Chart is to be developed for use in quality control.The average of the ranges is calculated to be 0.60.This was based on several samples of size 7 each.What would the lower control limit be?
(Multiple Choice)
4.7/5 (27)
Jack Joyner,Director of Quality Control at Covington Castings (CC),is designing a c chart to monitor the number of nonconformances per aluminum casting produced at CC.The total number of nonconformances for 26 castings is 91.The lower control limit for Jack's c chart is ___.
(Multiple Choice)
4.8/5 (34)
Ophelia O'Brien,VP of Consumer Credit of Credit First Banks (CFB),is designing a p chart to monitor the default rate on personal loans at the CFB member banks.Her data includes the proportion in default for 30 samples of personal loans.Each sample contained 50 loans,and the average of the 30 proportions is 0.05.The lower control limit for Ophelia's p chart is ___.
(Multiple Choice)
4.8/5 (32)
A quality circle is a round-table of top-level quality managers.
(True/False)
4.8/5 (25)
A company that uses benchmarking as a quality improvement practice will ___.
(Multiple Choice)
4.7/5 (31)
A quality circle studying the problem of incorrect prices on purchase orders identified several potential causes: incorrect information from requesting department,out-of-date catalogues from suppliers,defective computer software,and worker practices in the purchasing department.These potential cause-and-effect relationships are best illustrated by a ___.
(Multiple Choice)
4.9/5 (28)
Quality control is essentially final inspection of the products to ensure that no defectives are shipped out.
(True/False)
4.8/5 (37)
Filters
- Essay(0)
- Multiple Choice(0)
- Short Answer(0)
- True False(0)
- Matching(0)