Exam 5: Economic Efficiency, Government Price Setting and Taxes
Exam 1: Economics: Foundations and Models160 Questions
Exam 2: Choices and Trade-Offs in the Market192 Questions
Exam 3: Where Prices Come From: the Interaction of Demand and Supply202 Questions
Exam 4: Elasticity: the Responsiveness of Demand and Supply226 Questions
Exam 5: Economic Efficiency, Government Price Setting and Taxes187 Questions
Exam 6: Consumer Choice and Behavioural Economics254 Questions
Exam 7: Technology, Production and Costs300 Questions
Exam 8: Firms in Perfectly Competitive Markets270 Questions
Exam 9: Monopoly Markets281 Questions
Exam 10: Monopolistic Competition253 Questions
Exam 11: Oligopoly: Firms in Less Competitive Markets186 Questions
Exam 12: The Markets for Labour and Other Factors of Production253 Questions
Exam 13: International Trade131 Questions
Exam 14: Government Intervention in the Market122 Questions
Exam 15: Externalities, Environmental Policy and Public Goods212 Questions
Exam 16: The Distribution of Income and Social Policy121 Questions
Select questions type
Which of the following is not a result of imposing a rent ceiling?
(Multiple Choice)
4.8/5  (43)
(43)
The total amount of consumer surplus in a market is equal to the area below the demand curve.
(True/False)
4.8/5 (35)
Table 5-4
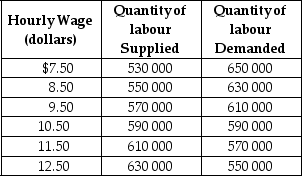 Table 5-4 shows the demand and supply schedules for labour market in the city of Pixley.
-Refer to Table 5-4.If a minimum wage of $12.50 is mandated,there will be a
Table 5-4 shows the demand and supply schedules for labour market in the city of Pixley.
-Refer to Table 5-4.If a minimum wage of $12.50 is mandated,there will be a
(Multiple Choice)
4.9/5 (36)
The total amount of producer surplus in a market is equal to the area below the supply curve.
(True/False)
4.7/5 (36)
Table 5-1
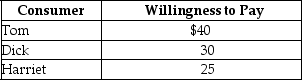 -Refer to Table 5-1.The table above lists the highest prices three consumers,Tom,Dick and Harriet,are willing to pay for a short-sleeved polo shirt.If the price of the shirts falls from $28 to $20,
(Multiple Choice)
4.9/5 (32)
Figure 5-7 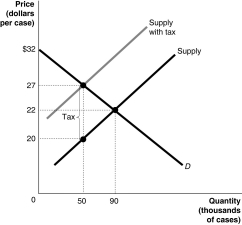 Figure 5-7 shows the market for beer.The government plans to impose a unit tax in this market.
-Refer to Figure 5-7.For each unit sold,the price sellers receive after the tax (net of tax)is
Figure 5-7 shows the market for beer.The government plans to impose a unit tax in this market.
-Refer to Figure 5-7.For each unit sold,the price sellers receive after the tax (net of tax)is
(Multiple Choice)
4.8/5 (33)
Figure 5-4 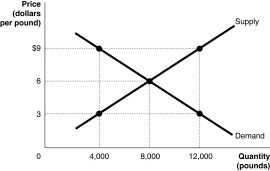 -Refer to Figure 5-4.The figure above represents the market for pecans.Assume that this is a competitive market.If 8000 pounds of pecans are sold,
(Multiple Choice)
5.0/5 (39)
Economic efficiency is defined as a market outcome in which the marginal benefit to consumers of the last unit produced is equal to the marginal cost of production,and in which
(Multiple Choice)
4.8/5 (28)
Figure 5-7 Figure 5-7 shows the market for beer.The government plans to impose a unit tax in this market.
-Refer to Figure 5-7.The price buyers pay after the tax is
(Multiple Choice)
4.8/5 (34)
Which of the following is not a result of government price controls?
(Multiple Choice)
4.8/5 (32)
Figure 5-3 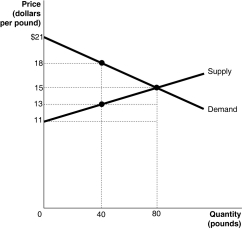 Figure 5-3 shows the market for tiger shrimp.The market is initially in equilibrium at a price of $15 and a quantity of 80.Now suppose producers decide to cut output to 40 in order to raise the price to $18.
-Refer to Figure 5-3.What is the value of producer surplus at a price of $18?
Figure 5-3 shows the market for tiger shrimp.The market is initially in equilibrium at a price of $15 and a quantity of 80.Now suppose producers decide to cut output to 40 in order to raise the price to $18.
-Refer to Figure 5-3.What is the value of producer surplus at a price of $18?
(Multiple Choice)
5.0/5 (36)
Figure 5-1 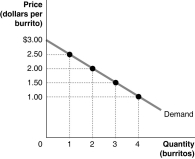 Figure 5-1 shows Arnold's demand curve for burritos.
-Refer to Figure 5-1.If the market price is $1.00,what is Arnold's consumer surplus?
Figure 5-1 shows Arnold's demand curve for burritos.
-Refer to Figure 5-1.If the market price is $1.00,what is Arnold's consumer surplus?
(Multiple Choice)
4.7/5 (28)
Table 5-4
Table 5-4 shows the demand and supply schedules for labour market in the city of Pixley.
-Refer to Table 5-4.If a minimum wage of $12.50 an hour is mandated,what is the quantity of labour demanded?
(Multiple Choice)
4.8/5 (29)
Table 5-4
Table 5-4 shows the demand and supply schedules for labour market in the city of Pixley.
-Refer to Table 5-4.Suppose that the quantity of labour demanded decreases by 80 000 at each wage level.What are the new free market equilibrium hourly wage and the new equilibrium quantity of labour?
(Multiple Choice)
4.7/5 (35)
Consumers are willing to purchase a product up to the point where
(Multiple Choice)
4.8/5 (37)
Filters
- Essay(0)
- Multiple Choice(0)
- Short Answer(0)
- True False(0)
- Matching(0)