Exam 5: Economic Efficiency, Government Price Setting and Taxes
Exam 1: Economics: Foundations and Models160 Questions
Exam 2: Choices and Trade-Offs in the Market192 Questions
Exam 3: Where Prices Come From: the Interaction of Demand and Supply202 Questions
Exam 4: Elasticity: the Responsiveness of Demand and Supply226 Questions
Exam 5: Economic Efficiency, Government Price Setting and Taxes187 Questions
Exam 6: Consumer Choice and Behavioural Economics254 Questions
Exam 7: Technology, Production and Costs300 Questions
Exam 8: Firms in Perfectly Competitive Markets270 Questions
Exam 9: Monopoly Markets281 Questions
Exam 10: Monopolistic Competition253 Questions
Exam 11: Oligopoly: Firms in Less Competitive Markets186 Questions
Exam 12: The Markets for Labour and Other Factors of Production253 Questions
Exam 13: International Trade131 Questions
Exam 14: Government Intervention in the Market122 Questions
Exam 15: Externalities, Environmental Policy and Public Goods212 Questions
Exam 16: The Distribution of Income and Social Policy121 Questions
Select questions type
The government proposes a tax on imported champagne.Buyers will bear the entire burden of the tax if the
(Multiple Choice)
4.8/5  (33)
(33)
Table 5-6
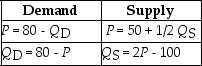 -Refer to Table 5-6.The equations above describe the demand and supply for Chef Ernie's Sushi-on-a-Stick.What are the equilibrium price and quantity (in thousands)for Chef Ernie's sushi?
(Multiple Choice)
4.9/5 (37)
Figure 5-1 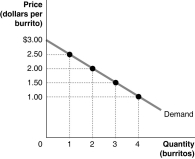 Figure 5-1 shows Arnold's demand curve for burritos.
-Refer to Figure 5-1.If the market price is $2.00,what is the consumer surplus on the first burrito?
Figure 5-1 shows Arnold's demand curve for burritos.
-Refer to Figure 5-1.If the market price is $2.00,what is the consumer surplus on the first burrito?
(Multiple Choice)
4.8/5 (29)
Table 5-2
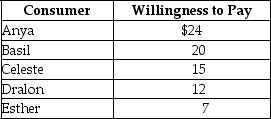 -Refer to Table 5-2.The table above lists the highest prices five consumers are willing to pay for a theatre ticket.If the price of one ticket is $25,
(Multiple Choice)
4.8/5 (33)
If the quantity of soccer balls demanded is represented by the equation QD = 80 - 2P,then the corresponding price of soccer balls is represented by the equation
(Multiple Choice)
4.8/5 (38)
The following equations represent the demand and supply for bottles of nail polish.
QD = 25 - P
QS = -15 + 3P
What is the equilibrium price (P)and quantity (Q - in thousands)of bottles of nail polish?
(Multiple Choice)
4.8/5 (28)
Figure 5-4 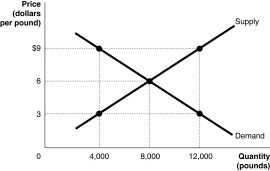 -Refer to Figure 5-4.The figure above represents the market for pecans.Assume that this is a competitive market.If the price of pecans is $9,what changes in the market would result in an economically efficient output?
(Multiple Choice)
4.7/5 (26)
If marginal benefit is greater than marginal cost,output is inefficiently high.
(True/False)
4.9/5 (30)
Suppose an excise tax of $1 is imposed on every case of beer sold,and sellers are responsible for paying this tax.How would the imposition of the tax be illustrated in a graph?
(Multiple Choice)
4.9/5 (32)
Figure 5-4
-Refer to Figure 5-4.The figure above represents the market for pecans.Assume that this is a competitive market.If the price of pecans is $3,what changes in the market would result in an economically efficient output?
(Multiple Choice)
4.7/5 (33)
Table 5-6
-Refer to Table 5-6.The equations above describe the demand and supply for Chef Ernie's Sushi-on-a-Stick.The equilibrium price and quantity for Chef Ernie's sushi are $60 and 20 thousand units.What is the value of economic surplus in this market?
(Multiple Choice)
4.8/5 (40)
The graph below represents the market for lychee nuts.The equilibrium price is $7.00 per bushel,but the market price is $5.00 per bushel.Identify the areas representing consumer surplus,producer surplus,and deadweight loss at the equilibrium price of $7.00 and at the market price of $5.00. 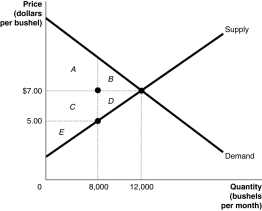
(Essay)
5.0/5 (31)
Table 5-3
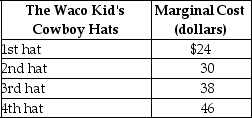 -Refer to Table 5-3.The table above lists the marginal cost of cowboy hats by The Waco Kid,a firm that specialises in producing fancy dress costumes.If the price of cowboy hats increases from $38 to $46,
(Multiple Choice)
4.9/5 (41)
The division of the burden of a tax between buyers and sellers in a market is called tax allocation.
(True/False)
4.8/5 (39)
Table 5-2
-Refer to Table 5-2.The table above lists the highest prices five consumers are willing to pay for a theatre ticket.If the price of one of the tickets is $10,
(Multiple Choice)
4.9/5 (39)
A ________ curve shows the marginal cost of producing one more unit of a good or service.
(Multiple Choice)
4.8/5 (29)
The difference between the ________ and the ________ from the sale of a product is called producer surplus.
(Multiple Choice)
4.7/5 (40)
Filters
- Essay(0)
- Multiple Choice(0)
- Short Answer(0)
- True False(0)
- Matching(0)