Exam 5: Economic Efficiency, Government Price Setting and Taxes
Exam 1: Economics: Foundations and Models160 Questions
Exam 2: Choices and Trade-Offs in the Market192 Questions
Exam 3: Where Prices Come From: the Interaction of Demand and Supply202 Questions
Exam 4: Elasticity: the Responsiveness of Demand and Supply226 Questions
Exam 5: Economic Efficiency, Government Price Setting and Taxes187 Questions
Exam 6: Consumer Choice and Behavioural Economics254 Questions
Exam 7: Technology, Production and Costs300 Questions
Exam 8: Firms in Perfectly Competitive Markets270 Questions
Exam 9: Monopoly Markets281 Questions
Exam 10: Monopolistic Competition253 Questions
Exam 11: Oligopoly: Firms in Less Competitive Markets186 Questions
Exam 12: The Markets for Labour and Other Factors of Production253 Questions
Exam 13: International Trade131 Questions
Exam 14: Government Intervention in the Market122 Questions
Exam 15: Externalities, Environmental Policy and Public Goods212 Questions
Exam 16: The Distribution of Income and Social Policy121 Questions
Select questions type
Figure 5-4 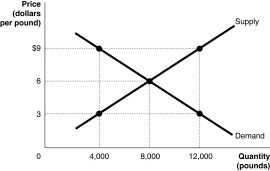 -Refer to Figure 5-4.The figure above represents the market for pecans.Assume that this is a competitive market.If the price of pecans is $3,
(Multiple Choice)
4.9/5  (43)
(43)
Figure 5-1 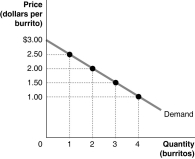 Figure 5-1 shows Arnold's demand curve for burritos.
-Refer to Figure 5-1.If the market price is $3.00,what is the maximum number of burritos that Arnold will buy?
Figure 5-1 shows Arnold's demand curve for burritos.
-Refer to Figure 5-1.If the market price is $3.00,what is the maximum number of burritos that Arnold will buy?
(Multiple Choice)
4.7/5 (41)
The following equations represent the demand and supply for silver pendants.
QD = 50 - 2P
QS = -10 + 2P
What is the equilibrium price (P)and quantity (Q - in thousands)of pendants?
(Multiple Choice)
5.0/5 (40)
Figure 5-1 Figure 5-1 shows Arnold's demand curve for burritos.
-Refer to Figure 5-1.What is the total amount that Arnold is willing to pay for 4 burritos?
(Multiple Choice)
4.9/5 (39)
Figure 5-1 Figure 5-1 shows Arnold's demand curve for burritos.
-Refer to Figure 5-1.If the market price is $1.50,what is Arnold's consumer surplus?
(Multiple Choice)
4.8/5 (32)
Figure 5-2 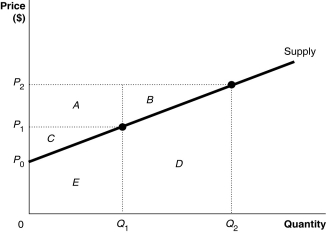 -Refer to Figure 5-2.What area represents producer surplus at a price of P2?
(Multiple Choice)
4.8/5 (29)
Table 5-4
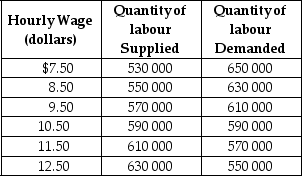 Table 5-4 shows the demand and supply schedules for labour market in the city of Pixley.
-Refer to Table 5-4.Suppose that the quantity of labour supplied increases by 40 000 at each wage level.What are the new free market equilibrium hourly wage and the new equilibrium quantity of labour?
Table 5-4 shows the demand and supply schedules for labour market in the city of Pixley.
-Refer to Table 5-4.Suppose that the quantity of labour supplied increases by 40 000 at each wage level.What are the new free market equilibrium hourly wage and the new equilibrium quantity of labour?
(Multiple Choice)
4.8/5 (38)
Figure 5-5 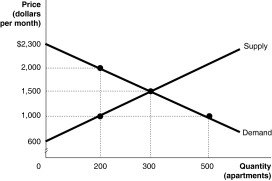 Figure 5-5 shows the market for apartments in Springfield.Recently,the government imposed a rent ceiling of $1000 per month.
-Refer to Figure 5-5.What is the value of producer surplus after the imposition of the ceiling?
Figure 5-5 shows the market for apartments in Springfield.Recently,the government imposed a rent ceiling of $1000 per month.
-Refer to Figure 5-5.What is the value of producer surplus after the imposition of the ceiling?
(Multiple Choice)
4.8/5 (38)
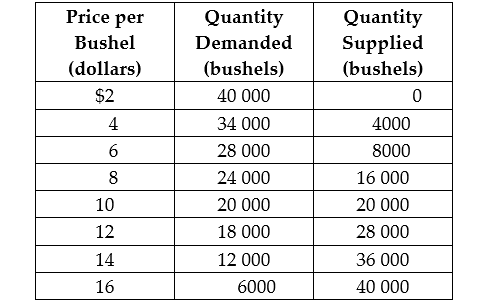
The demand and supply equations for the apple market are:
Demand: P = 12 - 0.01Q
Supply: P = 0.02Q
where P= price per bushel,and Q = quantity.
a.Calculate the equilibrium price and quantity.
b.Suppose the government guaranteed producers a price of $10 per bushel.What would be the effect on quantity supplied? Provide a numerical value.
c.By how much would the $10 price change the quantity of apples demanded? Provide a numerical value.
d.Would there be a shortage or surplus of apples?
e.What is the size of this shortage or surplus? Provide a numerical value.
(Essay)
4.8/5 (28)
Figure 5-5 Figure 5-5 shows the market for apartments in Springfield.Recently,the government imposed a rent ceiling of $1000 per month.
-Refer to Figure 5-5.Suppose that instead of a rent ceiling,the government imposed a price floor of $2000 per month for apartments.What is the quantity of apartments demanded at the new price?
(Multiple Choice)
4.8/5 (41)
________ refers to the reduction in economic surplus resulting from not being in competitive equilibrium.
(Multiple Choice)
4.9/5 (39)
Figure 5-5 Figure 5-5 shows the market for apartments in Springfield.Recently,the government imposed a rent ceiling of $1000 per month.
-Refer to Figure 5-5.Suppose that instead of a rent ceiling,the government imposed a price floor of $2000 per month for apartments.What is the value of consumer surplus after the imposition of the price floor?
(Multiple Choice)
4.8/5 (30)
Table 5-2
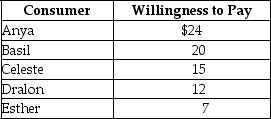 -Refer to Table 5-2.The table above lists the highest prices five consumers are willing to pay for a theatre ticket.If the price of one ticket falls from $25 to $10,
(Multiple Choice)
4.9/5 (46)
Table 5-5
 -Refer to Figure 5-6 which shows the market for vitamins.Suppose the government imposes a price ceiling of Pv.How will the price ceiling affect the quantity supplied,quantity demanded and quantity exchanged?
(Essay)
4.8/5 (40)
Figure 5-7 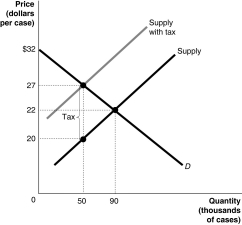 Figure 5-7 shows the market for beer.The government plans to impose a unit tax in this market.
-Refer to Figure 5-7.How much of the tax is paid by producers?
Figure 5-7 shows the market for beer.The government plans to impose a unit tax in this market.
-Refer to Figure 5-7.How much of the tax is paid by producers?
(Multiple Choice)
4.9/5 (39)
Consumer surplus in a market for a product would be equal to ________ if the market price was zero.
(Multiple Choice)
4.9/5 (38)
Will equilibrium in a market always result in an outcome that is economically efficient? Explain.
(Essay)
4.8/5 (41)
Figure 5-4
-Refer to Figure 5-4.The figure above represents the market for pecans.Assume that this is a competitive market.If 4000 pounds of pecans are sold,
(Multiple Choice)
4.9/5 (34)
Table 5-3
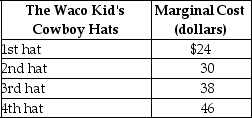 -Refer to Table 5-3.The table above lists the marginal cost of cowboy hats by The Waco Kid,a firm that specialises in producing fancy dress costumes.If the market price of cowboy hats is $35,The Waco Kid will produce
(Multiple Choice)
4.8/5 (29)
Filters
- Essay(0)
- Multiple Choice(0)
- Short Answer(0)
- True False(0)
- Matching(0)