Exam 7: Technology, Production and Costs
Exam 1: Economics: Foundations and Models160 Questions
Exam 2: Choices and Trade-Offs in the Market192 Questions
Exam 3: Where Prices Come From: the Interaction of Demand and Supply202 Questions
Exam 4: Elasticity: the Responsiveness of Demand and Supply226 Questions
Exam 5: Economic Efficiency, Government Price Setting and Taxes187 Questions
Exam 6: Consumer Choice and Behavioural Economics254 Questions
Exam 7: Technology, Production and Costs300 Questions
Exam 8: Firms in Perfectly Competitive Markets270 Questions
Exam 9: Monopoly Markets281 Questions
Exam 10: Monopolistic Competition253 Questions
Exam 11: Oligopoly: Firms in Less Competitive Markets186 Questions
Exam 12: The Markets for Labour and Other Factors of Production253 Questions
Exam 13: International Trade131 Questions
Exam 14: Government Intervention in the Market122 Questions
Exam 15: Externalities, Environmental Policy and Public Goods212 Questions
Exam 16: The Distribution of Income and Social Policy121 Questions
Select questions type
Figure 7-10 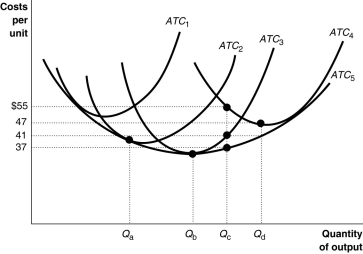 -Refer to Figure 7-10.Suppose for the past 8 years the firm has been producing Qd units per period using plant size ATC4.Now,following a permanent change in demand,it plans to cut production to Qc units.What will happen to its average cost of production?
(Multiple Choice)
4.8/5  (26)
(26)
Figure 7-11 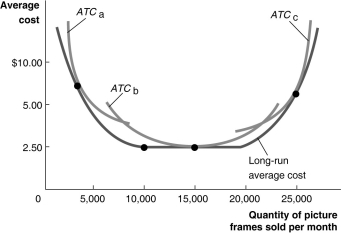 Figure 7-11 illustrates the long-run average cost curve for a firm that produces picture frames.The graph also includes short-run average cost curves for three firm sizes: ATCa,ATCb and ATCc.
-Refer to Figure 7-11.In the short run,if the firm sells fewer than 5000 picture frames per month,
Figure 7-11 illustrates the long-run average cost curve for a firm that produces picture frames.The graph also includes short-run average cost curves for three firm sizes: ATCa,ATCb and ATCc.
-Refer to Figure 7-11.In the short run,if the firm sells fewer than 5000 picture frames per month,
(Multiple Choice)
4.9/5 (38)
Figure 7-11 Figure 7-11 illustrates the long-run average cost curve for a firm that produces picture frames.The graph also includes short-run average cost curves for three firm sizes: ATCa,ATCb and ATCc.
-Refer to Figure 7-11.Constant returns to scale
(Multiple Choice)
5.0/5 (31)
The absolute value of the slope of an isocost line equals the ratio of
(Multiple Choice)
4.9/5 (30)
If a firm experiences positive technological change,it is able to produce more output using the same inputs.
(True/False)
4.8/5 (32)
Suppose a firm uses labour and capital to produce output.The last unit of labour hired has a marginal product of 12 units of output,and the last unit of capital employed has a marginal product of 20 units.Use the optimal combination of inputs rule to calculate the price of capital if the price of labour is $6 per unit.The price of capital is
(Multiple Choice)
4.9/5 (35)
Average total cost is equal to average variable cost minus average fixed cost.
(True/False)
4.9/5 (37)
If a firm is experiencing diseconomies of scale,its long-run average cost curve is increasing.
(True/False)
4.9/5 (27)
Table 7-1
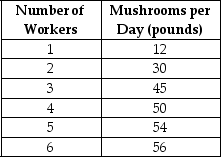 Table 7-1 shows the technology of production at the Matsuko's Mushroom Farm for the month of May.
-Refer to Table 7-1.What is the average product of labour when the farm hires 5 workers?
Table 7-1 shows the technology of production at the Matsuko's Mushroom Farm for the month of May.
-Refer to Table 7-1.What is the average product of labour when the farm hires 5 workers?
(Multiple Choice)
4.7/5 (36)
Which of the following statements best describes the economic short run?
(Multiple Choice)
4.9/5 (32)
Suppose the price of capital and labour remain constant but that the average educational level of workers has increased and therefore,productivity of labour increases.This would lead a firm
(Multiple Choice)
4.9/5 (36)
Figure 7-2 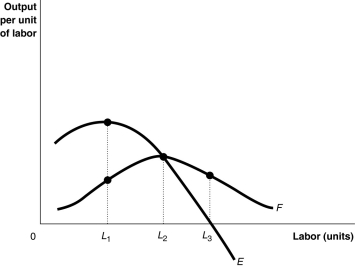 -Refer to Figure 7-2.Short run output is maximised at
(Multiple Choice)
4.9/5 (30)
Figure 7-13 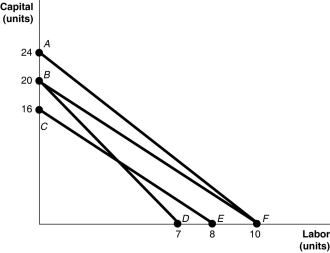 -Refer to Figure 7-13.The lines shown in the diagram are isocost lines.Which of the following shows a decrease in the price of capital while the price of labour remains unchanged?
(Multiple Choice)
4.9/5 (36)
A U-shaped long run average cost curve implies that a firm experiences economies of scale at low levels of production and diseconomies of scale at high levels of production.
(True/False)
4.8/5 (29)
Red Stone Creamery currently hires 5 workers.When it added a 6th worker,its output actually fell.Which of the following statements is true?
(Multiple Choice)
4.8/5 (28)
If an airport decides to expand by building an additional passenger terminal,and in doing so it lowers its average cost per airplane landing,it was previously operating at
(Multiple Choice)
5.0/5 (29)
Filters
- Essay(0)
- Multiple Choice(0)
- Short Answer(0)
- True False(0)
- Matching(0)