Exam 19: GDP: Measuring Total Production and Income
Exam 1: Economics: Foundations and Models444 Questions
Exam 2: Trade-Offs, Comparative Advantage, and the Market System498 Questions
Exam 3: Where Prices Come From: the Interaction of Demand and Supply475 Questions
Exam 4: Economic Efficiency, Government Price Setting, and Taxes419 Questions
Exam 5: Externalities, Environmental Policy, and Public Goods266 Questions
Exam 6: Elasticity: the Responsiveness of Demand and Supply295 Questions
Exam 7: The Economics of Health Care334 Questions
Exam 8: Firms, the Stock Market, and Corporate Governance278 Questions
Exam 9: Comparative Advantage and the Gains From International Trade379 Questions
Exam 10: Consumer Choice and Behavioral Economics302 Questions
Exam 11: Technology, Production, and Costs330 Questions
Exam 12: Firms in Perfectly Competitive Markets298 Questions
Exam 13: Monopolistic Competition: the Competitive Model in a More Realistic Setting276 Questions
Exam 14: Oligopoly: Firms in Less Competitive Markets262 Questions
Exam 15: Monopoly and Antitrust Policy271 Questions
Exam 16: Pricing Strategy263 Questions
Exam 17: The Markets for Labor and Other Factors of Production286 Questions
Exam 18: Public Choice, Taxes, and the Distribution of Income258 Questions
Exam 19: GDP: Measuring Total Production and Income266 Questions
Exam 20: Unemployment and Inflation292 Questions
Exam 21: Economic Growth, the Financial System, and Business Cycles257 Questions
Exam 22: Long-Run Economic Growth: Sources and Policies268 Questions
Exam 23: Aggregate Expenditure and Output in the Short Run306 Questions
Exam 24: Aggregate Demand and Aggregate Supply Analysis284 Questions
Exam 25: Money, Banks, and the Federal Reserve System280 Questions
Exam 26: Monetary Policy277 Questions
Exam 27: Fiscal Policy303 Questions
Exam 28: Inflation, Unemployment, and Federal Reserve Policy257 Questions
Exam 29: Macroeconomics in an Open Economy278 Questions
Exam 30: The International Financial System262 Questions
Select questions type
Scenario 19-1
CANOES-R-US makes canoes. It buys the shell of the canoe from another firm for $300 and uses its labor and intermediate goods to make the canoe. It sells the finished canoe to a retail canoe store for $800. The retail canoe store then sells the canoe to a consumer for $1,200.
-Refer to Scenario 19-1. The value added of CANOES-R-US for each canoe equals
Free
(Multiple Choice)
4.9/5  (41)
(41)
Correct Answer: Verified
C
The largest component of spending in GDP is
Free
(Multiple Choice)
4.8/5 (38)
Correct Answer:Verified
A
The purchase by a foreign government of an airplane produced in the United States is included in U.S.
Free
(Multiple Choice)
4.8/5 (30)
Correct Answer:Verified
D
Caroline is an artist. She purchases canvas, paints, brushes, and accessories for $75. She sells one of her original paintings to an art gallery for $1,500, even though an art lover would pay $4,500 for that painting. How much value does Caroline add?
(Multiple Choice)
4.8/5 (35)
In a small economy, consumption spending in 2013 is $6,000, government spending is $1,200, gross investment is $1,500, exports are $2,000, and imports are $1,000. What is gross domestic product in 2013?
(Multiple Choice)
4.8/5 (26)
Table 19-26
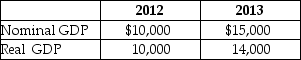 -Refer to Table 19-26. Given the information above, calculate the GDP deflator for both 2012 and 2013. What does the value of the deflator in the year 2012 tell you about that year with respect to the base year? What happened to prices in 2013 as compared to 2012?
(Essay)
4.9/5 (29)
To calculate GDP using the value-added method, one would add up
(Multiple Choice)
4.7/5 (35)
In a small economy, gross investment in 2013 is $1,500, consumption spending is $6,000, net investment is $200, government spending is $1,500, exports are $2,000 and imports are $1,000. What is GDP for this economy in 2013?
(Multiple Choice)
4.9/5 (41)
Table 19-10
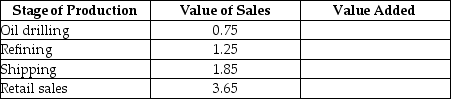 a) What is the value added by each stage of production?
b) What is the total value added?
For simplicity, you can ignore the cost of the inputs for oil drilling.
-The Philippines and Vietnam have roughly the same size population. Suppose the GDP of the Philippines is $1,000 billion and the GDP of Vietnam is $10,000 billion. You should conclude
a) What is the value added by each stage of production?
b) What is the total value added?
For simplicity, you can ignore the cost of the inputs for oil drilling.
-The Philippines and Vietnam have roughly the same size population. Suppose the GDP of the Philippines is $1,000 billion and the GDP of Vietnam is $10,000 billion. You should conclude
(Multiple Choice)
4.8/5 (31)
What is the underground economy and how could it hurt an economy? How does it hurt developing economies?
(Essay)
4.8/5 (39)
The GDP deflator in year 2 is 105, using year 1 as the base year. This means that, on average, the cost of goods and services is
(Multiple Choice)
4.8/5 (34)
Table 19-24
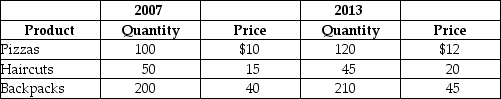 -Refer to Table 19-24. Suppose that a very simple economy produces three goods: pizzas, haircuts, and backpacks. Suppose the quantities produced and their corresponding prices for 2007 and 2013 are shown in the table above. Use the information to compute real GDP in the year 2007 and 2013. Calculate real GDP in 2013 assuming the base year is 2007. Do the same calculation assuming the base year is 2013. Are the calculations different? Why?
(Essay)
5.0/5 (32)
The circular flow of income shows that GDP can be measured as the sum of wages, interest, rent, and profits received by households or total expenditures on goods and services by households, firms, government, and the rest of the world.
(True/False)
4.9/5 (30)
In the circular flow diagram, the value of all the income in the economy is greater than the value of goods and services produced in the economy.
(True/False)
4.7/5 (37)
The size of the underground economy would tend to decrease if the government of a country
(Multiple Choice)
4.8/5 (33)
Table 19-26
-Which of the following is included in both the U.S. GDP and U.S. GNP?
(Multiple Choice)
4.9/5 (37)
Increases in real GDP would understate the well-being of a country over time if, over that time period, the
(Multiple Choice)
4.7/5 (42)
Filters
- Essay(0)
- Multiple Choice(0)
- Short Answer(0)
- True False(0)
- Matching(0)