Exam 12: Monetary Policy and the Phillips Curve
Exam 1: Introduction to Macroeconomics34 Questions
Exam 2: Measuring the Macroeconomy98 Questions
Exam 3: An Overview of Long- Run Economic Growth102 Questions
Exam 4: A Model of Production113 Questions
Exam 5: The Solow Growth Model116 Questions
Exam 6: Growth and Ideas102 Questions
Exam 7: The Labor Market,wages,and Unemployment100 Questions
Exam 8: Inflation99 Questions
Exam 9: An Introduction to the Short Run96 Questions
Exam 10: The Great Recession: a First Look95 Questions
Exam 11: The Is Curve101 Questions
Exam 12: Monetary Policy and the Phillips Curve100 Questions
Exam 13: Stabilization Policy and the Asad Framework97 Questions
Exam 14: The Great Recession and the Short-Run Model99 Questions
Exam 15: Consumption98 Questions
Exam 16: Investment101 Questions
Exam 17: The Government and the Macroeconomy96 Questions
Exam 18: International Trade96 Questions
Exam 19: Exchange Rates and International Finance109 Questions
Exam 20: Parting Thoughts31 Questions
Select questions type
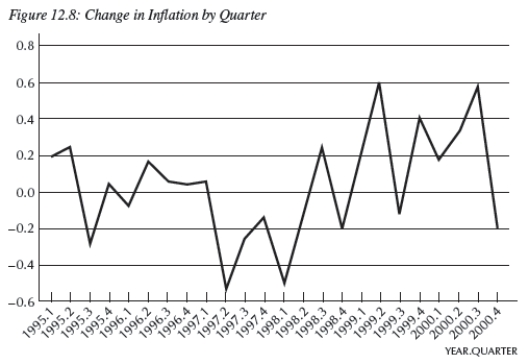 -Consider Figure 12.8,which shows the change in inflation
  From 1995.1 to 2000.4,by quarter.You are Federal Reserve chairman Greenspan and today's date is the second quarter of 1997 (1997.2).Given the information you have,using the Phillips curve,to stabilize the economy,you would __________,risking __________.
(Multiple Choice)
4.8/5  (40)
(40)
If the Fed mistakenly believes that potential output is higher than it actually is,it might conduct inflationary monetary policy.
(True/False)
4.8/5 (45)
When economists say "sticky inflation," they mean that inflation does not react directly with the monetary policy.
(True/False)
4.9/5 (42)
According to the Fisher equation,the real interest rate is given by
(Multiple Choice)
4.9/5 (30)
The link between real and nominal interest rates is called:
(Multiple Choice)
4.7/5 (43)
According to the Phillips curve,if current output equals potential output,
(Multiple Choice)
4.8/5 (38)
Monetary economists find that it takes anywhere from six to eight weeks for monetary policy to have a substantial impact on economic activity.
(True/False)
4.7/5 (37)
One of the explanations for the high rates of inflation in the 1970s was a productivity slowdown.
(True/False)
4.9/5 (45)
Which of the following scenarios best describes the short-run model?
(Multiple Choice)
4.8/5 (26)
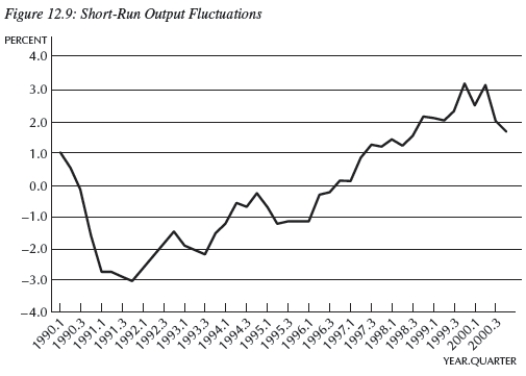 -Consider Figure 12.9,which shows short-run output fluctuations
  From 1990.1 to 2000.4,by quarter.If this is all the information you have,during the period 1997.1-1993.4,from the Phillips curve,you would conclude that:
(Multiple Choice)
5.0/5 (39)
If the price of oil unexpectedly rises,the Phillips curve shifts down and to the right.
(True/False)
4.9/5 (47)
With adaptive expectations,the Phillips curve is written as:
(Multiple Choice)
4.9/5 (40)
Filters
- Essay(0)
- Multiple Choice(0)
- Short Answer(0)
- True False(0)
- Matching(0)