Exam 12: Monetary Policy and the Phillips Curve
Exam 1: Introduction to Macroeconomics34 Questions
Exam 2: Measuring the Macroeconomy98 Questions
Exam 3: An Overview of Long- Run Economic Growth102 Questions
Exam 4: A Model of Production113 Questions
Exam 5: The Solow Growth Model116 Questions
Exam 6: Growth and Ideas102 Questions
Exam 7: The Labor Market,wages,and Unemployment100 Questions
Exam 8: Inflation99 Questions
Exam 9: An Introduction to the Short Run96 Questions
Exam 10: The Great Recession: a First Look95 Questions
Exam 11: The Is Curve101 Questions
Exam 12: Monetary Policy and the Phillips Curve100 Questions
Exam 13: Stabilization Policy and the Asad Framework97 Questions
Exam 14: The Great Recession and the Short-Run Model99 Questions
Exam 15: Consumption98 Questions
Exam 16: Investment101 Questions
Exam 17: The Government and the Macroeconomy96 Questions
Exam 18: International Trade96 Questions
Exam 19: Exchange Rates and International Finance109 Questions
Exam 20: Parting Thoughts31 Questions
Select questions type
The structure of the short-run model is best described as which of the following?
(Multiple Choice)
4.8/5  (32)
(32)
When the Federal Reserve increases the interest rate,the MP curve shifts up and potential output falls.
(True/False)
4.8/5 (29)
The MP curve stands for __________ and describes __________.
(Multiple Choice)
4.8/5 (32)
According to the Phillips curve,if current output is above potential output,
(Multiple Choice)
4.8/5 (31)
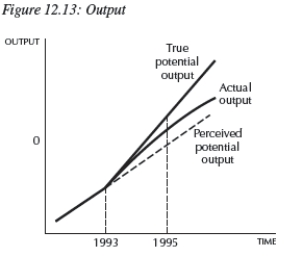 -Explain how misunderstanding potential real GDP can lead to the wrong monetary policy.
(Essay)
4.8/5 (31)
What is the main policy tool available to the Federal Reserve?
(Multiple Choice)
4.7/5 (31)
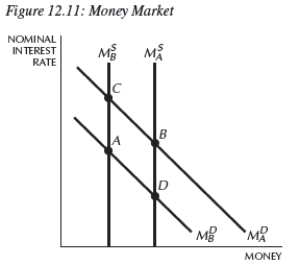 -Starting at any equilibrium in Figure 12.11,if the Fed tightens money,the money market would move from:
(Multiple Choice)
4.8/5 (42)
What tool does the U.S.Federal Reserve use to conduct policy? Explain.How does monetary policy impact the macroeconomy?
(Essay)
4.8/5 (33)
When the Federal Reserve loosens money,the __________ and interest rates __________.
(Multiple Choice)
4.8/5 (42)
When the Federal Reserve wants to increase the money supply,it:
(Multiple Choice)
4.9/5 (37)
According to the Fisher equation,the nominal interest rate is equal to:
(Multiple Choice)
4.9/5 (32)
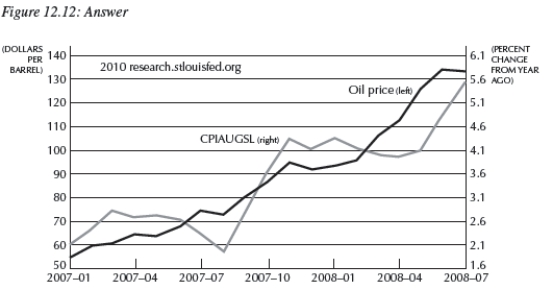 -Consider Figure 12.12 below,which shows the price of oil from January 2007-July 2008.What are the impacts of this on the macroeconomy? In particular which curve does this impact? Explain.
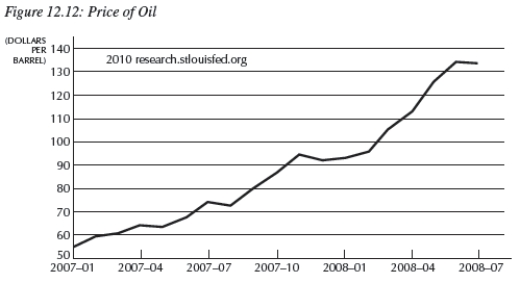
(Essay)
4.8/5 (36)
Which of the following contributed to high levels of inflation in the 1970s?
i.oil price shocks
ii.lower taxes
iii.a productivity slowdown
(Multiple Choice)
4.8/5 (38)
Filters
- Essay(0)
- Multiple Choice(0)
- Short Answer(0)
- True False(0)
- Matching(0)