Exam 2: Charts and Graphs
Exam 1: Introduction to Statistics94 Questions
Exam 2: Charts and Graphs92 Questions
Exam 3: Descriptive Statistics81 Questions
Exam 4: Probability87 Questions
Exam 5: Discrete Distributions88 Questions
Exam 6: Continuous Distributions90 Questions
Exam 7: Sampling and Sampling Distributions93 Questions
Exam 8: Statistical Inference: Estimation for Single Populations88 Questions
Exam 9: Statistical Inference: Hypothesis Testing for Single Populations101 Questions
Exam 10: Statistical Inferences About Two Populations98 Questions
Exam 11: A Nalysis of Variance and Design of Experiments106 Questions
Exam 12: Simple Regression Analysis and Correlation106 Questions
Exam 13: Multiple Regression Analysis93 Questions
Exam 14: Building Multiple Regression Models95 Questions
Exam 15: Time-Series Forecasting and Index Numbers94 Questions
Exam 16: Analysis of Categorical Data85 Questions
Exam 17: Nonparametric Statistics99 Questions
Exam 18: Statistical Quality Control86 Questions
Exam 19: Decision Analysis91 Questions
Select questions type
The staff of Mr.Wayne Wertz,VP of Operations at Portland Peoples Bank,prepared a frequency histogram of waiting time for drive up ATM customers. 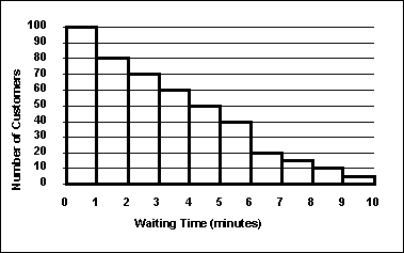 Approximately ____ drive up ATM customers waited at least 7 minutes.
(Multiple Choice)
4.8/5  (47)
(47)
For a company in gardening supplies business,the best graphical way to show the percentage of a total budget that is spent on each of a number of different expense categories is the stem and leaf plot.
(True/False)
4.8/5 (41)
An instructor made a frequency table of the scores his students got on a test 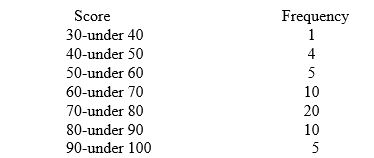 Approximately what percent of students got more than 70?
(Multiple Choice)
4.8/5 (31)
The number of phone calls arriving at a switchboard each hour has been recorded,and the following frequency distribution has been developed.  What is the relative frequency of the second class?
(Multiple Choice)
4.7/5 (41)
The following is a bar chart of the self-reported race for 189 pregnant women. 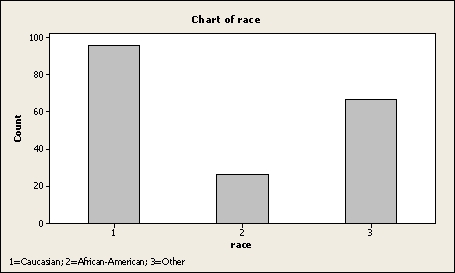 Approximately _____ percent of pregnant women are African-American
(Multiple Choice)
4.7/5 (41)
The following pie chart shows the market shares of the three only brands in a market at the end of last year: 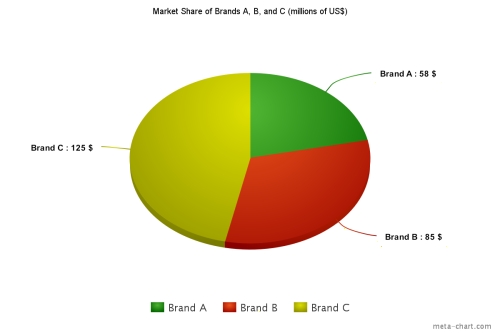 If by the end of the current year,brand C increases its market share to 51%,brand B maintains its market share,and total market sales increase by 15%,then this year's sales for brand A will be
(Multiple Choice)
4.8/5 (32)
The staffs of the accounting and the quality control departments rated their respective supervisor's leadership style as either (1)authoritarian or (2)participatory. Sixty-eight percent of the accounting staff rated their supervisor "authoritarian," and thirty-two percent rated him "participatory." Forty percent of the quality control staff rated their supervisor "authoritarian," and sixty percent rated her "participatory." The best graphic depiction of these data would be two ___________________.
(Multiple Choice)
4.7/5 (30)
The 2010 and 2012 market share data of the three competitors (Alston,Baren,and Clemson)in an oligopolistic industry are presented in the following pie charts. Total sales for this industry were $1.5 billion in 2010 and $1.8 billion in 2012.Clemson's sales in 2010 were ___________. 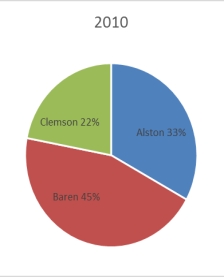
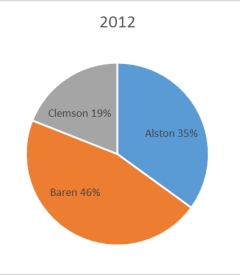
(Multiple Choice)
4.9/5 (40)
Each day,the office staff at Oasis Quick Shop prepares a frequency distribution and an ogive of sales transactions by dollar value of the transactions. Saturday's cumulative frequency ogive follows. 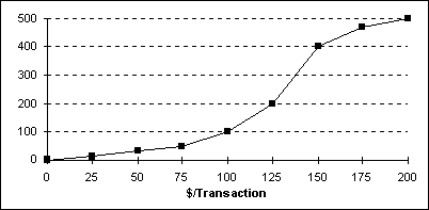 The total number of sales transactions on Saturday was _____________.
(Multiple Choice)
4.9/5 (24)
Abel Alonzo,Director of Human Resources,is exploring employee absenteeism at the Harrison Haulers Plant during the last operating year. A review of all personnel records indicated that absences ranged from zero to twenty-nine days per employee. The following class intervals were proposed for a frequency distribution of absences.  Which of the following might represent a problem with this set of intervals?
(Multiple Choice)
4.8/5 (40)
The staff of Ms.Tamara Hill,VP of Technical Analysis at Blue Sky Brokerage,prepared a frequency histogram of market capitalization of the 937 corporations listed on the American Stock Exchange in January 2013. 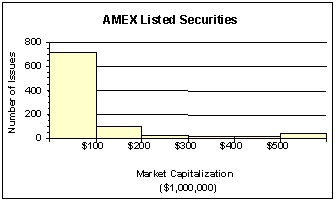 Approximately ________ corporations had capitalization exceeding $200,000,000.
(Multiple Choice)
4.8/5 (37)
Consider the following frequency distribution:  What is the relative frequency of the second class interval?
(Multiple Choice)
4.8/5 (30)
Filters
- Essay(0)
- Multiple Choice(0)
- Short Answer(0)
- True False(0)
- Matching(0)