Exam 2: Charts and Graphs
Exam 1: Introduction to Statistics94 Questions
Exam 2: Charts and Graphs92 Questions
Exam 3: Descriptive Statistics81 Questions
Exam 4: Probability87 Questions
Exam 5: Discrete Distributions88 Questions
Exam 6: Continuous Distributions90 Questions
Exam 7: Sampling and Sampling Distributions93 Questions
Exam 8: Statistical Inference: Estimation for Single Populations88 Questions
Exam 9: Statistical Inference: Hypothesis Testing for Single Populations101 Questions
Exam 10: Statistical Inferences About Two Populations98 Questions
Exam 11: A Nalysis of Variance and Design of Experiments106 Questions
Exam 12: Simple Regression Analysis and Correlation106 Questions
Exam 13: Multiple Regression Analysis93 Questions
Exam 14: Building Multiple Regression Models95 Questions
Exam 15: Time-Series Forecasting and Index Numbers94 Questions
Exam 16: Analysis of Categorical Data85 Questions
Exam 17: Nonparametric Statistics99 Questions
Exam 18: Statistical Quality Control86 Questions
Exam 19: Decision Analysis91 Questions
Select questions type
Pinky Bauer,Chief Financial Officer of Harrison Haulers,Inc.,suspects irregularities in the payroll system and orders an inspection of "each and every payroll voucher issued since January 1,2000." Each payroll voucher was inspected and the following frequency distribution was compiled.  The midpoint of the first class interval is _________.
(Multiple Choice)
4.8/5  (40)
(40)
A frequency distribution was developed. The lower endpoint of the first class is 9.30,and the midpoint is 9.35. What is the upper endpoint of this class?
(Multiple Choice)
4.9/5 (41)
A recent survey of U.S.automobile owners showed the following preferences for exterior automobile colors: 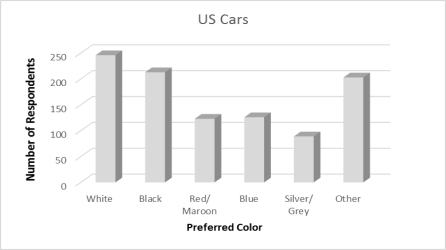 What are the top two color preferences for automobiles?
(Multiple Choice)
4.8/5 (40)
Consider the following stem and leaf plot:  Suppose that a frequency distribution was developed from this,and there were 5 classes (10-under 20,20-under 30,etc.). What would the frequency be for class 30-under 40?
(Multiple Choice)
4.9/5 (42)
Pinky Bauer,Chief Financial Officer of Harrison Haulers,Inc.,suspects irregularities in the payroll system and orders an inspection of "each and every payroll voucher issued since January 1,2000." Each payroll voucher was inspected and the following frequency distribution was compiled.  The relative frequency of the first class interval is _________.
(Multiple Choice)
4.9/5 (47)
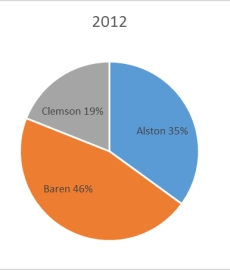
The 2010 and 2012 market share data of the three competitors (Alston,Baren,and Clemson)in an oligopolistic industry are presented in the following pie charts. Total sales for this industry were $1.5 billion in 2010 and $1.8 billion in 2012.Baren's sales in 2010 were ___________. 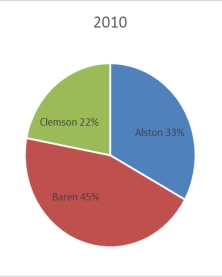
(Multiple Choice)
4.9/5 (44)
The staff of Ms.Tamara Hill,VP of technical analysis at Blue Sky Brokerage,prepared a frequency histogram of market capitalization of the 937 corporations listed on the American Stock Exchange in January 2016. 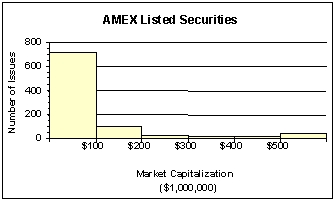 Approximately ________% of corporations had capitalization not exceeding $200,000,000.
(Multiple Choice)
4.9/5 (32)
A cumulative frequency distribution provides a running total of the frequencies in the classes.
(True/False)
4.9/5 (32)
A person has decided to construct a frequency distribution for a set of data containing 60 numbers. The lowest number is 23 and the highest number is 68. If 7 classes are used,the class width should be approximately _______.
(Multiple Choice)
4.9/5 (40)
The following graphic of residential housing data (selling price and size in square feet)is a _____________. 
(Multiple Choice)
4.7/5 (33)
A scatter plot is a two-dimensional graph plot of data containing pairs of observations on two numerical variables.
(True/False)
4.8/5 (28)
Consider the following frequency distribution:  What is the midpoint of the first class?
(Multiple Choice)
4.8/5 (41)
A graphical representation of a frequency distribution is called a pie chart.
(True/False)
4.8/5 (30)
Suppose a market survey of 200 consumers was conducted to determine the likelihood of each consumer purchasing a new computer next year.The data were collected based on the age of the consumer and are shown below:  Using the table above,which of the following statements is true?
(Multiple Choice)
4.9/5 (39)
Each day,the manager at Jamie's Auto Care Shop prepares a frequency distribution and a histogram of sales transactions by dollar value of the transactions. Friday's histogram follows. 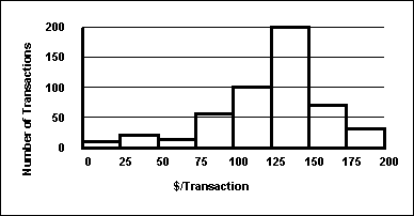 On Friday,the approximate number of sales transactions in the 75-under 100 category was _____________.
(Multiple Choice)
5.0/5 (35)
The customer help center in your company receives calls from customers who need help with some of the customized software solutions your company provides.The staff prepare the following cumulative frequency ogive for waiting times during the last three months.What percentage of customers had waiting times exceeding 6 minutes? 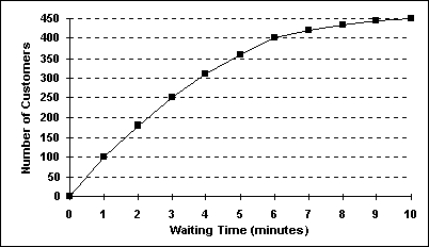
(Multiple Choice)
4.9/5 (28)
The staff of Mr.Wayne Wertz,VP of Operations at Portland Peoples Bank,prepared a cumulative frequency ogive of waiting time for walk-in customers.  The percentage of walk-in customers waiting one minute or less was _________.
(Multiple Choice)
4.8/5 (35)
The staff of Mr.Wayne Wertz,VP of Operations at Portland Peoples Bank,prepared a cumulative frequency ogive of waiting time for walk-in customers.  The total number of walk-in customers included in the study was _________.
(Multiple Choice)
4.7/5 (40)
Consider the following frequency distribution:  What is the midpoint of the first class?
(Multiple Choice)
4.8/5 (39)
The difference between the highest number and the lowest number in a set of data is called the differential frequency.
(True/False)
4.8/5 (34)
Filters
- Essay(0)
- Multiple Choice(0)
- Short Answer(0)
- True False(0)
- Matching(0)