Exam 3: Cost Behavior
Exam 1: Introduction to Cost Management157 Questions
Exam 2: Basic Cost Management Concepts201 Questions
Exam 3: Cost Behavior200 Questions
Exam 4: Activity-Based Costing201 Questions
Exam 5: Product and Service Costing: Job-Order System150 Questions
Exam 6: Process Costing188 Questions
Exam 7: Allocating Costs of Support Departments and Joint Products173 Questions
Exam 8: Budgeting for Planning and Control Key200 Questions
Exam 9: Standard Costing: a Functional-Based Control Approach123 Questions
Exam 10: Decentralization: Responsibility Accounting, Performance Evaluation, and Transfer Pricing139 Questions
Exam 11: Strategic Cost Management151 Questions
Exam 12: Activity-Based Management146 Questions
Exam 13: The Balanced Scorecard: Strategic-Based Control124 Questions
Exam 14: Quality and Environmental Cost Management202 Questions
Exam 15: Lean Accounting and Productivity Measurement172 Questions
Exam 16: Cost-Volume-Profit Analysis138 Questions
Exam 17: Activity Resource Usage Model and Tactical Decision Making128 Questions
Exam 18: Pricing and Profitability Analysis164 Questions
Exam 19: Capital Investment126 Questions
Exam 20: Inventory Management: Economic Order Quantity, Jit, and the Theory of Constraints127 Questions
Select questions type
The hypothesis test of cost parameters indicates whether the parameters are different from __________ .
(Short Answer)
4.8/5  (34)
(34)
When Multiple regression is used, the user has a choice of using manual computation or using regression programs.
(True/False)
4.9/5 (36)
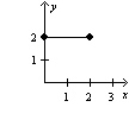
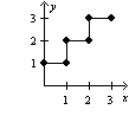
Given the following graphs, which graph represents fixed costs? 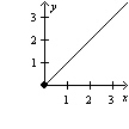

(Multiple Choice)
4.7/5 (37)
Figure 3-9 Hereford Company is planning to introduce a new product with an 80 percent learning rate for production for batches of 1,000 units. The variable labor costs are $30 per unit for the first 1,000-unit batch. Each batch requires 100 hours. There are $10,000 in fixed costs not subject to learning.
Refer to Figure 3-9. What is the cumulative average time per batch using the incremental unit-time learning curve for 2,000 units?
(Multiple Choice)
4.8/5 (33)
A nursing home requires one nurse for each six patients. This is an example of a
(Multiple Choice)
4.8/5 (36)
Which of the following statements is TRUE about relevant range?
(Multiple Choice)
4.8/5 (38)
The percentage of variability in the dependent variable explained by an independent variable (i.e. measure of activity output) is called the coefficient of correlation.
(True/False)
4.8/5 (42)
Costs that follow a step-cost behavior are defined as __________ costs.
or
(Short Answer)
4.9/5 (33)
If all the activity capacity acquired is not used, this is an example of
(Multiple Choice)
4.8/5 (38)
Assuming costs are represented on the vertical axis and volume of activity on the horizontal axis, which of the following costs would be represented by a line that is parallel to the horizontal axis?
(Multiple Choice)
4.7/5 (37)
Figure 3-1 Sonor Systems undertakes its own machine maintenance. The depreciation on the equipment is $20,000 per year and operating cost is $2 per machine hour. Last year 275,000 machine hours were used to produce 100,000 units.
See Figure 3-1. If 300,000 machine hours had been worked last year, what would be the total machine maintenance cost?
(Multiple Choice)
4.8/5 (39)
Figure 3-3 The Sandoval Company has four process engineers that are each able to process 1,500 design changes. Last year 5,250 design changes were produced by the four engineers. Each engineer is paid $60,000 per year.
Refer to Figure 3-3. Calculate the unused capacity.
(Multiple Choice)
5.0/5 (34)
Resources, such as direct materials, direct labor, electricity, equipment, and so on, are economic elements that enable one to perform activities.
(True/False)
4.8/5 (37)
The method for analyzing cost behavior that generally classifies general ledger accounts is
(Multiple Choice)
4.8/5 (37)
Which of the following is an advantage of using the scatterplot method over the high-low method to estimate costs?
(Multiple Choice)
4.9/5 (28)
As the volume of activity increases within the relevant range, the variable cost per unit
(Multiple Choice)
4.9/5 (38)
Cumulative average-time __________ curve assumes the cumulative average time per unit decreases by a constant percentage each time the cumulative quantity of units produced doubles.
(Short Answer)
4.7/5 (27)
Filters
- Essay(0)
- Multiple Choice(0)
- Short Answer(0)
- True False(0)
- Matching(0)