Exam 24: Aggregate Demand and Aggregate Supply Analysis
Exam 1: Economics: Foundations and Models142 Questions
Exam 2: Trade-Offs, comparative Advantage, and the Market System152 Questions
Exam 3: Where Prices Come From: the Interaction of Demand and Supply149 Questions
Exam 4: Economic Efficiency, government Price Setting, and Taxes137 Questions
Exam 5: Externalities, environmental Policy, and Public Goods139 Questions
Exam 6: Elasticity: The Responsiveness of Demand and Supply149 Questions
Exam 7: The Economics of Health Care117 Questions
Exam 8: Firms, the Stock Market, and Corporate Governance140 Questions
Exam 9: Comparative Advantage and the Gains From International Trade124 Questions
Exam 10: Consumer Choice and Behavioral Economics154 Questions
Exam 11: Technology, production, and Costs174 Questions
Exam 12: Firms in Perfectly Competitive Markets153 Questions
Exam 13: Monopolistic Competition: The Competitive Model in a More Realistic Setting137 Questions
Exam 14: Oligopoly: Firms in Less Competitive Markets129 Questions
Exam 15: Monopoly and Antitrust Policy148 Questions
Exam 16: Pricing Strategy134 Questions
Exam 17: The Markets for Labor and Other Factors of Production149 Questions
Exam 18: Public Choice, taxes, and the Distribution of Income134 Questions
Exam 19: GDP: Measuring Total Production and Income135 Questions
Exam 20: Unemployment and Inflation148 Questions
Exam 21: Economic Growth, the Financial System, and Business Cycles130 Questions
Exam 22: Long-Run Economic Growth: Sources and Policies134 Questions
Exam 23: Aggregate Expenditure and Output in the Short Run157 Questions
Exam 24: Aggregate Demand and Aggregate Supply Analysis145 Questions
Exam 25: Money, banks, and the Federal Reserve System144 Questions
Exam 26: Monetary Policy145 Questions
Exam 27: Fiscal Policy155 Questions
Exam 28: Inflation, unemployment, and Federal Reserve Policy135 Questions
Exam 29: Macroeconomics in an Open Economy145 Questions
Exam 30: The International Financial System139 Questions
Select questions type
Figure 24-4 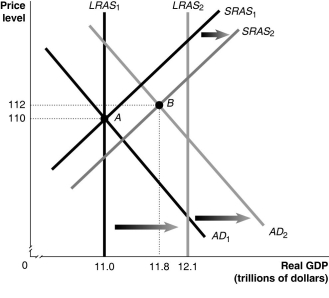 -Refer to Figure 24-4.Given the economy is at point A in year 1,what is the inflation rate between year 1 and year 2?
(Multiple Choice)
4.9/5  (41)
(41)
Why does the short-run aggregate supply curve shift to the right in the long run,following a decrease in aggregate demand?
(Multiple Choice)
4.9/5 (39)
Forecasts made by White House economists and economists at the Congressional Budget Office in 2011 project that real GDP
(Multiple Choice)
4.9/5 (33)
When the price of oil rises unexpectedly,the equilibrium price level ________ and the unemployment rate ________ in the short run.
(Multiple Choice)
4.9/5 (35)
If full-employment GDP is equal to $4.2 trillion,what does the long-run aggregate supply curve look like?
(Multiple Choice)
5.0/5 (41)
Suppose the economy is at full employment and firms become more optimistic about the future profitability of new investment.Which of the following will happen in the short run?
(Multiple Choice)
4.8/5 (45)
The short-run aggregate supply curve has a(n)________ slope because as prices of ________ rise,prices of ________ rise more slowly.
(Multiple Choice)
4.8/5 (31)
Figure 24-4
-Refer to Figure 24-4.In the figure above,LRAS1 and SRAS1 denote LRAS and SRAS in year 1,while LRAS2 and SRAS2 denote LRAS and SRAS in year 2.Given the economy is at point A in year 1,what is the growth rate in potential GDP in year 2?
(Multiple Choice)
4.9/5 (28)
Figure 24-3 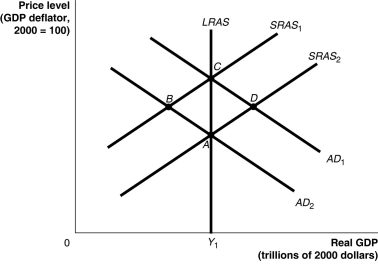 -Refer to Figure 24-3.Suppose the economy is at point C.If government spending decreases in the economy,where will the eventual long-run equilibrium be?
(Multiple Choice)
4.9/5 (50)
Explain how the economy moves back to full employment from recession.Be sure to detail what happens to short-run aggregate supply,unemployment,equilibrium GDP and the price level.
(Essay)
4.8/5 (36)
Using the aggregate supply and demand model,illustrate what happens in the long run when the economy suffers a supply shock.Begin your analysis by assuming the economy has suffered the supply shock in the short run,but has not yet adjusted to it in the long run.
(Essay)
4.9/5 (33)
After an unexpected ________ in the price of oil,the long-run adjustment decreases the price level and ________ the unemployment rate as they return to their original levels.
(Multiple Choice)
4.9/5 (42)
Which of the following models relies on emphasizing the importance of sticky wages and prices?
(Multiple Choice)
4.8/5 (32)
Which of the following is one reason for the decline in aggregate demand that led to the recession of 2007-2009?
(Multiple Choice)
4.7/5 (43)
Explain how the aggregate demand and aggregate supply model can be made more dynamic.
(Essay)
4.8/5 (41)
All of the following are reasons why the wages of workers and the prices of inputs rise more slowly than the prices of final goods and services except
(Multiple Choice)
4.9/5 (41)
Which of the following could explain why there is an increase in potential GDP but the equilibrium level of GDP does not rise?
(Multiple Choice)
4.8/5 (43)
Filters
- Essay(0)
- Multiple Choice(0)
- Short Answer(0)
- True False(0)
- Matching(0)