Exam 18: Public Choice,taxes,and the Distribution of Income
Exam 1: Economics: Foundations and Models233 Questions
Exam 2: Trade-Offs, comparative Advantage, and the Market System259 Questions
Exam 3: Where Prices Come From: the Interaction of Demand and Supply242 Questions
Exam 4: Economic Efficiency, government Price Setting, and Taxes208 Questions
Exam 5: Externalities, environmental Policy, and Public Goods267 Questions
Exam 6: Elasticity: The Responsiveness of Demand and Supply295 Questions
Exam 7: The Economics of Health Care169 Questions
Exam 8: Firms, the Stock Market, and Corporate Governance278 Questions
Exam 9: Comparative Advantage and the Gains From International Trade189 Questions
Exam 10: Consumer Choice and Behavioral Economics302 Questions
Exam 11: Technology, production, and Costs330 Questions
Exam 12: Firms in Perfectly Competitive Markets298 Questions
Exam 13: Monopolistic Competition: the Competitive Model in a More Realistic Setting278 Questions
Exam 14: Oligopoly: Firms in Less Competitive Markets262 Questions
Exam 15: Monopoly and Antitrust Policy271 Questions
Exam 16: Pricing Strategy263 Questions
Exam 17: The Markets for Labor and Other Factors of Production286 Questions
Exam 18: Public Choice,taxes,and the Distribution of Income258 Questions
Select questions type
According to projections for 2013 by the Tax Policy Center,the 20 percent of U.S.taxpayers who make the highest incomes
(Multiple Choice)
4.9/5  (33)
(33)
In the United States,over the past 40 years federal revenues as a share of gross domestic product have
(Multiple Choice)
4.8/5 (37)
Table 18-3
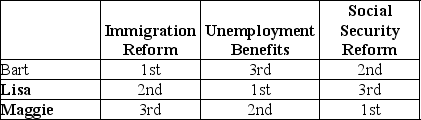 -Refer to Table 18-3.The table above outlines the rankings of three members of the U.S.Senate on three spending alternatives.Assume that Congress can spend additional revenue on only one of the three spending alternatives and that Bart,Lisa,and Maggie,all members of the Senate,participate in a series of votes in which they are to determine which of the spending alternatives should receive funding.Three votes will be taken: (1)Immigration Reform and Unemployment Benefits (2)Immigration Reform and Social Security Reform and (3)Unemployment Benefits and Social Security Reform.
Show the results of each vote and determine whether the voting paradox will occur as a result of these votes.
-Refer to Table 18-3.The table above outlines the rankings of three members of the U.S.Senate on three spending alternatives.Assume that Congress can spend additional revenue on only one of the three spending alternatives and that Bart,Lisa,and Maggie,all members of the Senate,participate in a series of votes in which they are to determine which of the spending alternatives should receive funding.Three votes will be taken: (1)Immigration Reform and Unemployment Benefits (2)Immigration Reform and Social Security Reform and (3)Unemployment Benefits and Social Security Reform.
Show the results of each vote and determine whether the voting paradox will occur as a result of these votes.
(Essay)
4.8/5 (33)
The public choice model raises questions about the government's ability to regulate economic activity efficiently.Which of the following statements represents the views of most economists with regard to the role of government?
(Multiple Choice)
4.8/5 (33)
Economists James Buchanan and Gordon Tullock are well-known for developing
(Multiple Choice)
5.0/5 (38)
In the United States,the largest source of funds for public schools is
(Multiple Choice)
4.7/5 (28)
What is the United States government's formal definition of the poverty line?
(Multiple Choice)
4.9/5 (44)
From 1970 to 2006,the poverty rate in East Asia rose slightly but the level of poverty in sub-Saharan Africa fell dramatically.
(True/False)
4.8/5 (39)
What are the two types of taxes that working individuals pay on their earnings?
(Multiple Choice)
4.9/5 (35)
Suppose,on average,a family in Church Falls earning $60,000 per year paid 6 percent of its income in state taxes.A family earning $80,000 paid,on average,$4,760 in state income taxes.Are state taxes in Church Falls progressive or regressive? Be sure to explain the difference between a progressive tax and a regressive tax.
(Essay)
4.9/5 (35)
Figure 18-2 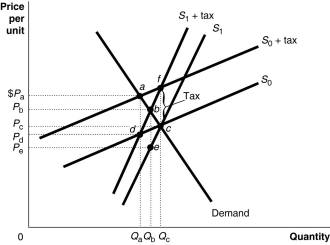 Figure 18-2 shows a demand curve and two sets of supply curves, one set more elastic than the other.
-Refer to Figure 18-2.If the government imposes an excise tax of $1.00 on every unit sold,
Figure 18-2 shows a demand curve and two sets of supply curves, one set more elastic than the other.
-Refer to Figure 18-2.If the government imposes an excise tax of $1.00 on every unit sold,
(Multiple Choice)
4.8/5 (35)
If grocery stores were legally required to charge a 10-cent fee for disposable grocery bags,who would bear the largest burden of this fee?
(Essay)
4.8/5 (33)
At the state and local levels in the United States,the largest source of tax revenue is
(Multiple Choice)
5.0/5 (36)
Figure 18-2 Figure 18-2 shows a demand curve and two sets of supply curves, one set more elastic than the other.
-Refer to Figure 18-2.If the government imposes an excise tax of $1.00 on every unit sold,the producer's burden of the tax
(Multiple Choice)
4.8/5 (34)
If the marginal tax rate is greater than the average tax rate,the tax structure is described as regressive.
(True/False)
4.8/5 (32)
Filters
- Essay(0)
- Multiple Choice(0)
- Short Answer(0)
- True False(0)
- Matching(0)