Exam 18: Public Choice,taxes,and the Distribution of Income
Exam 1: Economics: Foundations and Models233 Questions
Exam 2: Trade-Offs, comparative Advantage, and the Market System259 Questions
Exam 3: Where Prices Come From: the Interaction of Demand and Supply242 Questions
Exam 4: Economic Efficiency, government Price Setting, and Taxes208 Questions
Exam 5: Externalities, environmental Policy, and Public Goods267 Questions
Exam 6: Elasticity: The Responsiveness of Demand and Supply295 Questions
Exam 7: The Economics of Health Care169 Questions
Exam 8: Firms, the Stock Market, and Corporate Governance278 Questions
Exam 9: Comparative Advantage and the Gains From International Trade189 Questions
Exam 10: Consumer Choice and Behavioral Economics302 Questions
Exam 11: Technology, production, and Costs330 Questions
Exam 12: Firms in Perfectly Competitive Markets298 Questions
Exam 13: Monopolistic Competition: the Competitive Model in a More Realistic Setting278 Questions
Exam 14: Oligopoly: Firms in Less Competitive Markets262 Questions
Exam 15: Monopoly and Antitrust Policy271 Questions
Exam 16: Pricing Strategy263 Questions
Exam 17: The Markets for Labor and Other Factors of Production286 Questions
Exam 18: Public Choice,taxes,and the Distribution of Income258 Questions
Select questions type
Which of the following is an example of a federal mandate?
(Multiple Choice)
4.9/5  (37)
(37)
Economists often analyze the interaction of individuals and firms in markets.Economists also examine the actions of individuals and firms as they attempt to use government to make themselves better off at the expense of others,a process that is referred to as
(Multiple Choice)
5.0/5 (42)
Figure 18-6 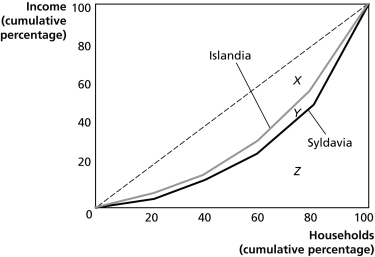 Figure 18-6 shows the Lorenz curves for Islandia and Syldavia.
-Refer to Figure 18-6.If area X = 2,060,area Y = 240,and area Z = 2,700,calculate the Gini coefficient for Islandia.
Figure 18-6 shows the Lorenz curves for Islandia and Syldavia.
-Refer to Figure 18-6.If area X = 2,060,area Y = 240,and area Z = 2,700,calculate the Gini coefficient for Islandia.
(Multiple Choice)
4.8/5 (41)
A common belief among political analysts is that someone running for his or her party's nomination for president of the United States must choose a different strategy once the nomination is secured.To be nominated,the candidate must appeal to voters from one party - Democrat or Republican - but in a general election a party's nominee must appeal to voters from both parties as well as independent voters.Which of the following offers the best explanation for this change in strategy?
(Multiple Choice)
4.9/5 (35)
What is the difference between a marginal tax rate and an average tax rate? Which is more important in determining the impact of the tax system on economic behavior?
(Essay)
4.8/5 (37)
Figure 18-9 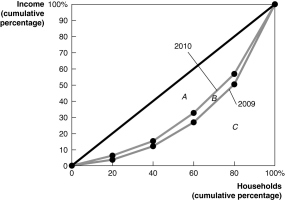 -Refer to Figure 18-9 to answer the following questions.
a.Did the distribution of income become more equal in 2010 that it was in 2009,or did it become less equal? Explain.
b.If area A = 1,600,area B = 200,and area C = 3,200,calculate the Gini coefficient for 2009 and the Gini coefficient for 2010.
-Refer to Figure 18-9 to answer the following questions.
a.Did the distribution of income become more equal in 2010 that it was in 2009,or did it become less equal? Explain.
b.If area A = 1,600,area B = 200,and area C = 3,200,calculate the Gini coefficient for 2009 and the Gini coefficient for 2010.
(Essay)
4.9/5 (32)
Sheldon Cleaver commented on the difficulty people have in overcoming poverty in the United States: "Most people whose incomes fall below the poverty line have difficulty pulling themselves above the line in future years.In this sense,poverty becomes a vicious cycle.I believe the psychological damage households face when they are branded with the 'poverty' label in our society is a major factor in their remaining in poverty.Despair is a major reason why the percentage of people with incomes that lie below the poverty line never falls below 10 percent." Which of the following correctly evaluates Cleaver's statement?
(Multiple Choice)
4.9/5 (31)
If,as your taxable income decreases,you pay a smaller percentage of your taxable income in taxes,then the tax is
(Multiple Choice)
4.9/5 (42)
Logrolling refers to attempts by individuals to use government action to make themselves better off at the expense of others.
(True/False)
4.9/5 (35)
A regressive tax is a tax for which people with lower incomes
(Multiple Choice)
4.8/5 (36)
A Gini coefficient of ________ means that an income distribution is perfectly equal and a Gini coefficient of ________ means the income distribution is perfectly unequal.
(Multiple Choice)
4.9/5 (38)
Figure 18-5 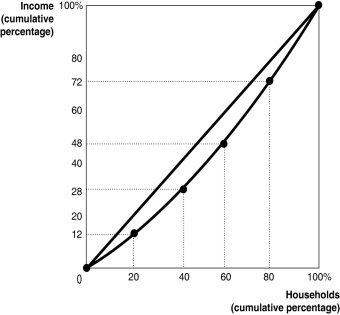 Figure 18-5 shows the Lorenz curve for a hypothetical country.
-Refer to Figure 18-5.The middle 20 percent of households
Figure 18-5 shows the Lorenz curve for a hypothetical country.
-Refer to Figure 18-5.The middle 20 percent of households
(Multiple Choice)
4.9/5 (35)
If you pay $3,000 in taxes on an income of $28,000,and $4,450 in taxes on an income of $38,000,what is your marginal tax rate? Show your work.
(Essay)
4.7/5 (31)
If your income is $40,000 and you pay taxes of $4,650,what is your average tax rate? Show your work.
(Essay)
4.9/5 (34)
What is the relationship between market failure and government failure?
(Essay)
4.9/5 (30)
Figure 18-2 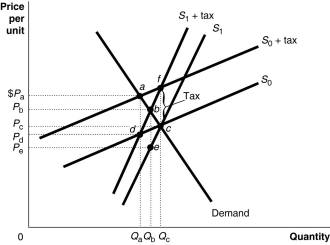 Figure 18-2 shows a demand curve and two sets of supply curves, one set more elastic than the other.
-Refer to Figure 18-2.If the government imposes an excise tax of $1.00 on every unit sold,the government's revenue from the tax
Figure 18-2 shows a demand curve and two sets of supply curves, one set more elastic than the other.
-Refer to Figure 18-2.If the government imposes an excise tax of $1.00 on every unit sold,the government's revenue from the tax
(Multiple Choice)
4.8/5 (42)
Figure 18-4 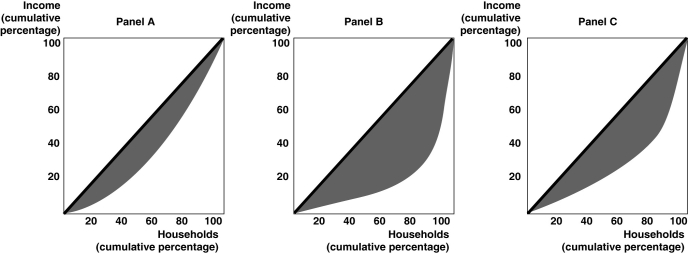 -Refer to Figure 18-4.Rank the above panels in terms of most unequal income distribution to least unequal income distribution.
(Multiple Choice)
4.7/5 (44)
Filters
- Essay(0)
- Multiple Choice(0)
- Short Answer(0)
- True False(0)
- Matching(0)