Exam 12: Aggregate Demand and Aggregate Supply
Exam 1: First Principles198 Questions
Exam 2: Economic Models: Trade-Offs and Trade296 Questions
Exam 3: Supply and Demand264 Questions
Exam 4: Price Controls and Quotas: Meddling With Markets200 Questions
Exam 5: International Trade258 Questions
Exam 6: Macroeconomics: the Big Picture153 Questions
Exam 7: Gdp and the Cpi: Tracking the Macroeconomy321 Questions
Exam 8: Unemployment and Inflation332 Questions
Exam 9: Long-Run Economic Growth298 Questions
Exam 10: Savings, Investment Spending, and the Financial System385 Questions
Exam 11: Income and Expenditure130 Questions
Exam 12: Aggregate Demand and Aggregate Supply345 Questions
Exam 13: Fiscal Policy346 Questions
Exam 14: Money, Banking, and the Federal Reserve System428 Questions
Exam 15: Monetary Policy340 Questions
Exam 16: Inflation, Disinflation, and Deflation221 Questions
Exam 17: Macroeconomics: Events and Ideas309 Questions
Exam 18: International Macroeconomics441 Questions
Exam 19: Graphs in Economics60 Questions
Select questions type
An economy operating at a real GDP level below its potential will have:
(Multiple Choice)
4.7/5  (40)
(40)
Use the following to answer questions: 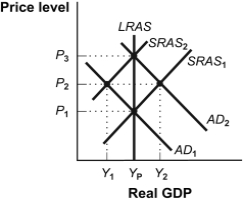 -(Figure: An Increase in Aggregate Demand)Refer to Figure: An Increase in Aggregate Demand.Because of the pressures at the short-run equilibrium at Y2 and P2:
(Multiple Choice)
4.8/5 (35)
An increase in the minimum wage would likely cause an increase in short-run aggregate supply.
(True/False)
4.8/5 (34)
Use the following to answer questions:  -(Figure: Inflationary and Recessionary Gaps)Refer to Figure: Inflationary and Recessionary Gaps.The intersection of AD with SRAS in panel (b)indicates:
(Multiple Choice)
4.9/5 (34)
The aggregate demand curve shows a negative relationship between the price level and the quantity of aggregate output demanded.
(True/False)
4.9/5 (30)
In the short run,when there is an increase in aggregate demand,the aggregate price level will _____ and the aggregate output level will _____.
(Multiple Choice)
4.9/5 (35)
According to the aggregate demand curve,when the aggregate price level _____,the quantity of aggregate output _____.
(Multiple Choice)
4.8/5 (35)
If the price level falls by 10%,the purchasing power of $10 000 will:
(Multiple Choice)
4.9/5 (39)
Use the following to answer questions: 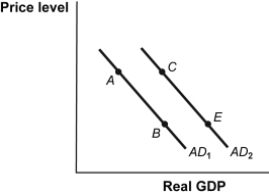 -(Figure: Shift of the Aggregate Demand Curve)Refer to Figure: Shift of the Aggregate Demand Curve.A movement from AD1 to AD2 may have been the result of:
(Multiple Choice)
4.7/5 (45)
Use the following to answer questions: 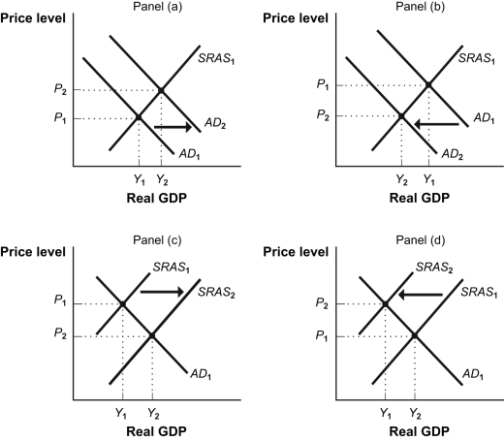 -(Figure: Shifts of the AD-AS Curves)Refer to Figure: Shifts of the AD-AS Curves.A short run increase in net exports is illustrated by panel:
(Multiple Choice)
4.9/5 (39)
When unemployment is high,in the short run,nominal wages will:
(Multiple Choice)
4.9/5 (39)
Use the following to answer questions:
-When the economy is producing output above the potential,it has:
(Multiple Choice)
4.9/5 (33)
Use the following to answer questions:
-(Figure: Inflationary and Recessionary Gaps)Refer to Figure: Inflationary and Recessionary Gaps.YP in panel (b):
(Multiple Choice)
5.0/5 (39)
Deflation was a problem in both the Great Depression and the recession of 1979-1982.
(True/False)
4.9/5 (30)
Use the following to answer questions: 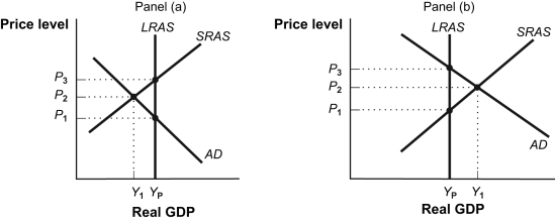 -(Figure: Inflationary and Recessionary Gaps)Refer to Figure: Inflationary and Recessionary Gaps.In panel (a),an expansionary policy designed to move the economy from Y1 to YP would attempt to shift the:
(Multiple Choice)
4.9/5 (33)
Suppose that the Canadian government doubles its spending on health care.The _____ curve shifts _____,output _____,and prices _____.
(Multiple Choice)
4.9/5 (39)
An increase in government spending,all other things unchanged,will cause the aggregate demand curve to:
(Multiple Choice)
4.9/5 (33)
The economic slump in the 1970s looked different from the slump at the beginning of the Great Depression because it was:
(Multiple Choice)
4.8/5 (41)
Filters
- Essay(0)
- Multiple Choice(0)
- Short Answer(0)
- True False(0)
- Matching(0)