Exam 21: The Influences of Monetary and Fiscal Policy on Aggregate Demand: How Monetary Policy Influences Aggregate Demand
Exam 1: Ten Principles of Economics24 Questions
Exam 1: Ten Principles of Economics: How People Make Decisions139 Questions
Exam 1: Ten Principles of Economics: How People Interact103 Questions
Exam 1: Ten Principles of Economics: How the Economy As a Whole Works73 Questions
Exam 1: Ten Principles of Economics: Part A53 Questions
Exam 1: Ten Principles of Economics: Part B51 Questions
Exam 2: Thinking Like an Economist2 Questions
Exam 2: Thinking Like an Economist: The Economist As Scientist256 Questions
Exam 2: Thinking Like an Economist: The Economist As Policy Adviser67 Questions
Exam 2: Thinking Like an Economist: Why Economists Disagree17 Questions
Exam 2: Thinking Like an Economist: Lets Get Going6 Questions
Exam 2: Thinking Like an Economist: Graphing a Brief Review68 Questions
Exam 2: Thinking Like an Economist: Part A56 Questions
Exam 2: Thinking Like an Economist: Part B136 Questions
Exam 3: Interdependence and the Gains From Trade2 Questions
Exam 3: Interdependence and the Gains From Trade: A Parable for the Modern Economy60 Questions
Exam 3: Interdependence and the Gains From Trade: Comparative Advantage the Driving Force of Specialization141 Questions
Exam 3: Interdependence and the Gains From Trade: Applications of Comparative Advantage20 Questions
Exam 3: Interdependence and the Gains From Trade: Conclusion1 Questions
Exam 3: Interdependence and the Gains From Trade: Part A40 Questions
Exam 3: Interdependence and the Gains From Trade: Part B69 Questions
Exam 4: The Market Forces of Supply and Demand3 Questions
Exam 4: The Market Forces of Supply and Demand:Markets and Competition46 Questions
Exam 4: The Market Forces of Supply and Demand: Demand150 Questions
Exam 4: The Market Forces of Supply and Demand: Supply96 Questions
Exam 4: The Market Forces of Supply and Demand: Supply and Demand Together158 Questions
Exam 4: The Market Forces of Supply and DemandConclusion How Prices Allocate Resources5 Questions
Exam 4: The Market Forces of Supply and Demand: Part A38 Questions
Exam 4: The Market Forces of Supply and Demand: Part B108 Questions
Exam 5: Elasticity and Its Applications6 Questions
Exam 5: Elasticity and Its Applications: The Elasticity of Demand303 Questions
Exam 5: Elasticity and Its Applications: The Elasticity of Supply86 Questions
Exam 5:Elasticity and Its Applications: Three Applications of Supply,demand,and Elasticity48 Questions
Exam 5: Elasticity and Its Applications: Part A49 Questions
Exam 5: Elasticity and Its Applications: Part B78 Questions
Exam 6: Supply Demand and Government Policies5 Questions
Exam 6: Supply Demand and Government Policies: Controls on Prices215 Questions
Exam 6: Supply Demand and Government Policies: Taxes199 Questions
Exam 6: Supply Demand and Government Policies: Part A46 Questions
Exam 6: Supply Demand and Government Policies: Part B166 Questions
Exam 7: Consumers Producers and the Efficiency of Markets10 Questions
Exam 7: Consumers Producers and the Efficiency of Markets: Consumer Surplus98 Questions
Exam 7: Consumers Producers and the Efficiency of Markets: Producer Surplus92 Questions
Exam 7: Consumers Producers and the Efficiency of Markets: Market Efficiency123 Questions
Exam 7: Consumers Producers and the Efficiency of Markets: Conclusion Market Efficiency and Market Failure7 Questions
Exam 7: Consumers Producers and the Efficiency of Markets: Part A46 Questions
Exam 7: Consumers Producers and the Efficiency of Markets: Part B65 Questions
Exam 8: Application the Cost of Taxation5 Questions
Exam 8: Application the Cost of Taxation: The Deadweight Loss of Taxation247 Questions
Exam 8: Application the Cost of Taxation: The Determinants of the Deadweight Loss61 Questions
Exam 8: Application the Cost of Taxation: Deadweight Loss and Tax Revenue As Taxes Vary62 Questions
Exam 8: Application the Cost of Taxation: Conclusion2 Questions
Exam 8: Application the Cost of Taxation: Part A58 Questions
Exam 8: Application the Cost of Taxation: Part B59 Questions
Exam 9: Application International Trade2 Questions
Exam 9: Application International Trade: The Determinants of Trade41 Questions
Exam 9: Application International Trade: The Winners and Losers From Trade302 Questions
Exam 9: Application International Trade: The Arguments for Restricting Trade40 Questions
Exam 9: Application International Trade: Conclusion3 Questions
Exam 9: Application International Trade: Part A53 Questions
Exam 9: Application International Trade: Part B68 Questions
Exam 10: Measuring a Nations Income6 Questions
Exam 10: Measuring a Nations Income: The Economy's Income and Expenditure27 Questions
Exam 10: Measuring a Nations Income: The Measurement of GDP117 Questions
Exam 10: Measuring a Nations Income: The Components of GDP106 Questions
Exam 10: Measuring a Nations Income: Real Versus Nominal GDP52 Questions
Exam 10: Measuring a Nations Income: Is GDP a Good Measure of Economic Well-Being22 Questions
Exam 10: Measuring a Nations Income: Part A44 Questions
Exam 10: Measuring a Nations Income: Part B86 Questions
Exam 11: Measuring the Cost of Living12 Questions
Exam 11: Measuring the Cost of Living: The Consumer Price Index195 Questions
Exam 11: Measuring the Cost of Living: Correcting Economic Variables for the Effects of Inflation124 Questions
Exam 11: Measuring the Cost of Living: Part A39 Questions
Exam 11: Measuring the Cost of Living: Part B83 Questions
Exam 12: Production and Growth16 Questions
Exam 12: Production and Growth: Economic Growth Around the World54 Questions
Exam 12: Production and Growth: Productivity Its Role and Determinants159 Questions
Exam 12: Production and Growth: Economic Growth and Public Policy157 Questions
Exam 12: Production and Growth: Conclusion the Importance of Long-Run Growth2 Questions
Exam 12: Production and Growth: Part A59 Questions
Exam 12: Production and Growth: Part B62 Questions
Exam 13: Saving Investment and the Financial System8 Questions
Exam 13: Saving Investment and the Financial System: Financial Institutions in the US economy177 Questions
Exam 13: Saving Investment and the Financial System: Saving and Investment in the National Income Accounts98 Questions
Exam 13: Saving Investment and the Financial System: The Market for Loanable Funds201 Questions
Exam 13: Saving Investment and the Financial System: Part A57 Questions
Exam 13: Saving Investment and the Financial System: Part B63 Questions
Exam 14: The Basic Tools of Finance2 Questions
Exam 14: The Basic Tools of Finance: Present Value Measuring the Time Value of Money213 Questions
Exam 14: The Basic Tools of Finance: Managing Risk120 Questions
Exam 14: The Basic Tools of Finance: Asset Valuation70 Questions
Exam 14: The Basic Tools of Finance: Conclusion2 Questions
Exam 14: The Basic Tools of Finance: Part A59 Questions
Exam 14: The Basic Tools of Finance: Part B54 Questions
Exam 15: Unemployment15 Questions
Exam 15: Unemployment: Identifying Unemployment163 Questions
Exam 15: Unemployment: Job Search40 Questions
Exam 15: Unemployment: Minimum-Wage Laws39 Questions
Exam 15: Unemployment: Unions and Collective Bargaining49 Questions
Exam 15: Unemployment: The Theory of Efficiency Wages41 Questions
Exam 15: Unemployment: Part A48 Questions
Exam 15: Unemployment: Part B221 Questions
Exam 16: The Monetary System17 Questions
Exam 16: The Monetary System: The Meaning of Money100 Questions
Exam 16: The Monetary System: The Federal Reserve System52 Questions
Exam 16: The Monetary System: Banks and the Money Supply78 Questions
Exam 16: The Monetary System: The Feds Tools of Monetary Control126 Questions
Exam 16: The Monetary System: Part A64 Questions
Exam 16: The Monetary System: Part B57 Questions
Exam 17: Money Growth and Inflation22 Questions
Exam 17: Money Growth and Inflation: The Classical Theory of Inflation245 Questions
Exam 17: Money Growth and Inflation: The Costs of Inflation94 Questions
Exam 17: Money Growth and Inflation: Conclusion3 Questions
Exam 17: Money Growth and Inflation: Part A63 Questions
Exam 17: Money Growth and Inflation: Part B60 Questions
Exam 18: Open Economy Macroeconomics Basic Concepts2 Questions
Exam 18: Open Economy Macroeconomics Basic Concepts: The International Flows of Goods and Capital227 Questions
Exam 18: Open Economy Macroeconomics Basic Concepts: The Prices for International Transactions Real and Nominal Exchange Rates76 Questions
Exam 18: Open Economy Macroeconomics Basic Concepts: A First Theory of Exchange-Rate Determination Purchasing-Power Parity87 Questions
Exam 18: Open Economy Macroeconomics Basic Concepts: Part A67 Questions
Exam 18: Open Economy Macroeconomics Basic Concepts: Part B63 Questions
Exam 19: A Macroeconomic Theory of the Open Economy3 Questions
Exam 19: A Macroeconomic Theory of the Open Economy: Supply and Demand for Loanable Funds and for Foreign-Currency Exchange141 Questions
Exam 19: A Macroeconomic Theory of the Open Economy: Equilibrium in the Open Economy45 Questions
Exam 19: A Macroeconomic Theory of the Open Economy: How Policies and Events Affect an Open Economy172 Questions
Exam 19: A Macroeconomic Theory of the Open Economy: Part A47 Questions
Exam 19: A Macroeconomic Theory of the Open Economy: Part B56 Questions
Exam 20: Aggregate Demand and Aggregate Supply6 Questions
Exam 20: Aggregate Demand and Aggregate Supply: Three Key Facts About Economic Fluctuations33 Questions
Exam 20: Aggregate Demand and Aggregate Supply: Explaining Short-Run Economic Fluctuations38 Questions
Exam 20: Aggregate Demand and Aggregate Supply: The Aggregate-Demand Curve141 Questions
Exam 20: Aggregate Demand and Aggregate Supply: The Aggregate-Supply Curve95 Questions
Exam 20: Aggregate Demand and Aggregate Supply: Two Causes of Economic Fluctuations117 Questions
Exam 20: Aggregate Demand and Aggregate Supply: Part A59 Questions
Exam 20: Aggregate Demand and Aggregate Supply: Part B61 Questions
Exam 21: The Influences of Monetary and Fiscal Policy on Aggregate Demand5 Questions
Exam 21: The Influences of Monetary and Fiscal Policy on Aggregate Demand: How Monetary Policy Influences Aggregate Demand198 Questions
Exam 21: The Influences of Monetary and Fiscal Policy on Aggregate Demand: How Fiscal Policy Influences Aggregate Demand123 Questions
Exam 21: The Influences of Monetary and Fiscal Policy on Aggregate Demand: Using Policy to Stabilize the Economy73 Questions
Exam 21: The Influences of Monetary and Fiscal Policy on Aggregate Demand: Part A60 Questions
Exam 21: The Influences of Monetary and Fiscal Policy on Aggregate Demand: Part B50 Questions
Exam 22: The Short Run Trade Off Between Inflation and Unemployment11 Questions
Exam 22: The Short Run Trade Off Between Inflation and Unemployment: The Phillips Curve86 Questions
Exam 22: The Short Run Trade Off Between Inflation and Unemployment: Shifts in the Phillips Curve the Role of Expectations161 Questions
Exam 22: The Short Run Trade Off Between Inflation and Unemployment: Shifts in the Phillips Curve the Role of Supply Shocks60 Questions
Exam 22: The Short Run Trade Off Between Inflation and Unemployment: The Cost of Reducing Inflation87 Questions
Exam 22: The Short Run Trade Off Between Inflation and Unemployment: Part A62 Questions
Exam 22: The Short Run Trade Off Between Inflation and Unemployment: Part B52 Questions
Exam 23: Six Debates Over Macroeconomic Policy: Should Monetary and Fiscal Policymakers Try to Stabilize the Economy44 Questions
Exam 23: Six Debates Over Macroeconomic Policy: Should the Government Fight Recessions With Spending Hikes Rather Than Tax Cuts15 Questions
Exam 23: Six Debates Over Macroeconomic Policy: Should Monetary Policy Be Made by Rule Rather Than by Discretion37 Questions
Exam 23: Six Debates Over Macroeconomic Policy: Should the Central Bank Aim for Zero Inflation49 Questions
Exam 23: Six Debates Over Macroeconomic Policy: Should the Government Balance Its Budget38 Questions
Exam 23: Six Debates Over Macroeconomic Policy: Should the Tax Laws Be Reformed to Encourage Saving44 Questions
Exam 23: Six Debates Over Macroeconomic Policy: Conclusion1 Questions
Exam 23: Six Debates Over Macroeconomic Policy: Part A68 Questions
Exam 23: Six Debates Over Macroeconomic Policy: Part B39 Questions
Exam 24: A-Financial-Overview-Of-The-US104 Questions
Select questions type
According to liquidity preference theory,a decrease in money demand for some reason other than a change in the price level causes
(Multiple Choice)
4.8/5  (35)
(35)
According to liquidity preference theory,the money-supply curve would shift if the Fed
(Multiple Choice)
4.8/5 (40)
Figure 34-3. 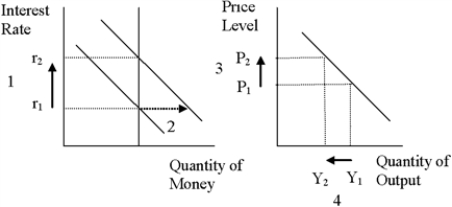 -Refer to Figure 34-3.For an economy such as the United States,what component of the demand for goods and services is most responsible for the decrease in output from Y1 to Y2?
(Multiple Choice)
4.9/5 (36)
Figure 34-4.On the figure,MS represents money supply and MD represents money demand. 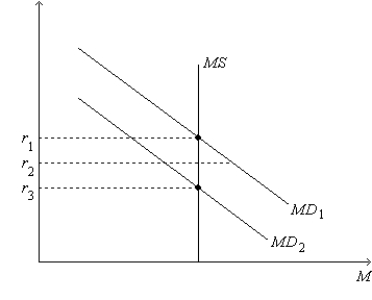 -Refer to Figure 34-4.Suppose the money-demand curve is currently MD2.If the current interest rate is r2,then
(Multiple Choice)
4.8/5 (45)
Figure 34-4.On the figure,MS represents money supply and MD represents money demand.
-Refer to Figure 34-4.Suppose the current equilibrium interest rate is r3.Which of the following events would cause the equilibrium interest rate to decrease?
(Multiple Choice)
4.8/5 (26)
According to the liquidity preference theory,an increase in the overall price level of 10 percent
(Multiple Choice)
4.8/5 (37)
To stabilize interest rates,the Federal Reserve will respond to an increase in money demand by
(Multiple Choice)
4.8/5 (30)
If expected inflation is constant,then when the nominal interest rate increases,the real interest rate
(Multiple Choice)
4.9/5 (39)
Figure 34-4.On the figure,MS represents money supply and MD represents money demand.
-Refer to Figure 34-4.Which of the following events could explain a decrease in the equilibrium interest rate from r1 to r3?
(Multiple Choice)
4.9/5 (36)
People might withdraw money from interest-bearing accounts,
(Multiple Choice)
4.8/5 (38)
Figure 34-4.On the figure,MS represents money supply and MD represents money demand.
-Refer to Figure 34-4.Suppose the current equilibrium interest rate is r3.Let Y3 represent the corresponding quantity of goods and services demanded,and let P3 represent the corresponding price level.Starting from this situation,if the Federal Reserve decreases the money supply and if the price level remains at P3,then
(Multiple Choice)
4.9/5 (43)
Other things equal,in the short run a lower price level leads households to
(Multiple Choice)
4.8/5 (35)
Figure 34-2.On the left-hand graph,MS represents the supply of money and MD represents the demand for money;on the right-hand graph,AD represents aggregate demand.The usual quantities are measured along the axes of both graphs.
. 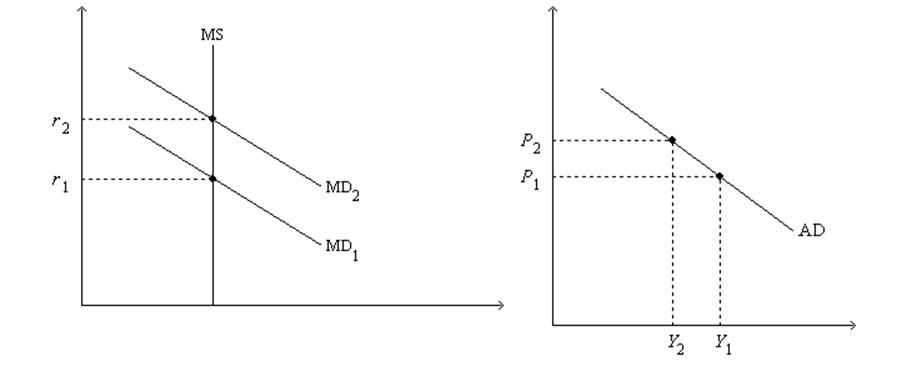 -Refer to Figure 34-2.A decrease in Y from Y1 to Y2 is explained as follows:
(Multiple Choice)
5.0/5 (37)
The wealth effect stems from the idea that a higher price level
(Multiple Choice)
4.8/5 (46)
The wealth effect helps explain the slope of the aggregate-demand curve.This effect is
(Multiple Choice)
4.8/5 (34)
Which of the following properly describes the interest-rate effect that helps explain the slope of the aggregate-demand curve?
(Multiple Choice)
4.9/5 (35)
If,at some interest rate,the quantity of money supplied is less than the quantity of money demanded,people will desire to
(Multiple Choice)
4.8/5 (44)
Filters
- Essay(0)
- Multiple Choice(0)
- Short Answer(0)
- True False(0)
- Matching(0)