Exam 11: Behind the Supply Curve- Inputs and Costs
Exam 1: First Principles198 Questions
Exam 2: Economic Models295 Questions
Exam 3: Supply and Demand264 Questions
Exam 4: Consumer and Producer Surplus228 Questions
Exam 5: Price Controls and Quotas215 Questions
Exam 6: Elasticity88 Questions
Exam 7: Taxes280 Questions
Exam 8: International Trade261 Questions
Exam 9: Decision Making by Individuals and Firms165 Questions
Exam 10: The Rational Consumer197 Questions
Exam 11: Behind the Supply Curve- Inputs and Costs357 Questions
Exam 12: Perfect Competition and the Supply Curve341 Questions
Exam 13: Monopoly316 Questions
Exam 14: Oligopoly272 Questions
Exam 15: Monopolistic Competition246 Questions
Exam 16: Externalities194 Questions
Exam 17: Public Goods and Common Resources180 Questions
Exam 18: The Economics of the Welfare State125 Questions
Exam 19: Factor Markets and the Distribution of Income317 Questions
Exam 20: Uncertainty, risk, and Private Information150 Questions
Exam 21: Graphs in Economics62 Questions
Exam 22: Consumer Preferences153 Questions
Exam 23: Indifference Curve Analysis41 Questions
Select questions type
Use the following to answer questions : Table: Cost Data Quantity of Output Variable Cost ( ) Total Cost ( ) 0 0 50 1 50 100 2 70 120 3 100 150 4 140 190 5 190 240 6 250 300 7 320 370
-(Table: Cost Data)Use Table: Cost Data.The average variable cost of producing five purses is:
(Multiple Choice)
5.0/5  (38)
(38)
When a firm produces a small amount of output,the spreading effect:
(Multiple Choice)
4.8/5 (30)
A farm can produce 1 000 kilograms of wheat per year with two workers,1 300 kilograms of wheat per year with three workers,and 1 500 kilograms of wheat per year with four workers.The marginal product of the fifth worker is _____ kilograms.
(Multiple Choice)
4.8/5 (33)
Use the following to answer questions : 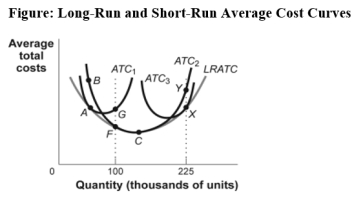 -When a firm adds capital,in the short run variable costs for any level of output will:
(Multiple Choice)
4.8/5 (40)
Use the following to answer questions : Table: Costs of Birthday Cakes Quantity of cakes Variable cost, 0 0 1 15 2 25 3 30 4 38 5 50 6 70
-(Table: Costs of Birthday Cakes)Use Table: Costs of Birthday Cakes.Assume that fixed costs are $10.What is the average total cost of two cakes?
(Multiple Choice)
4.8/5 (32)
At quantities greater than the long-run minimum cost per unit of output,the long-run average total cost curve is _____ of the corresponding short-run average total cost curve.
(Multiple Choice)
4.9/5 (46)
The larger the output,the more variable input required to produce additional units.Called the _____ effect,this leads to a _____ average _____ cost as the output rises.
(Multiple Choice)
4.8/5 (32)
Use the following to answer questions :
Figure and Table: Variable,Fixed,and Total Costs 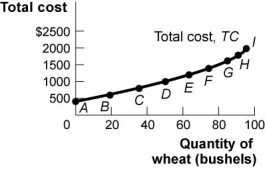 Points on Graph Quantity of Labour (workers), Quantity of Wheat (bushels), Variable Cost, Fixed Cost, Total Cost, = + A 0 0 \ 0 \ 400 \ 400 B 1 19 200 400 600 C 2 36 400 400 800 D 3 51 600 400 1000 E 4 64 800 400 1200 F 5 75 1000 400 1400 G 6 84 1200 400 1600 H 7 91 1400 400 1800 I 8 96 1600 400 2000
-(Figure and Table: Variable,Fixed,and Total Costs)Use Figure and Table: Variable,Fixed,and Total Costs.The marginal cost of increasing production from 51 to 64 kilograms of wheat is:
Points on Graph Quantity of Labour (workers), Quantity of Wheat (bushels), Variable Cost, Fixed Cost, Total Cost, = + A 0 0 \ 0 \ 400 \ 400 B 1 19 200 400 600 C 2 36 400 400 800 D 3 51 600 400 1000 E 4 64 800 400 1200 F 5 75 1000 400 1400 G 6 84 1200 400 1600 H 7 91 1400 400 1800 I 8 96 1600 400 2000
-(Figure and Table: Variable,Fixed,and Total Costs)Use Figure and Table: Variable,Fixed,and Total Costs.The marginal cost of increasing production from 51 to 64 kilograms of wheat is:
(Multiple Choice)
4.7/5 (34)
Use the following to answer question 44:
Figure: The Unknown Curve 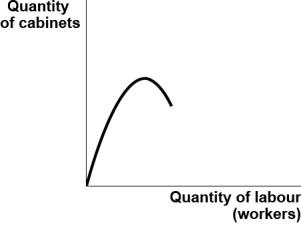 -(Figure: The Unknown Curve)Use Figure: The Unknown Curve.You are a cabinetmaker.You employ several workers to produce kitchen and bathroom cabinets.Your summer intern has drawn a graph showing a relationship between the number of cabinetmakers you employ and the number of cabinets produced.Unfortunately,your intern has failed to identify this curve.It is likely to be the _____ curve.
(Multiple Choice)
4.9/5 (32)
Use the following to answer questions : Table: Production Function for Soybeans Quantity of Labour (workers) Quantity of Soybeans (bushels) 0 0 1 25 2 45 3 60 4 70 5 75
-(Table: Production Function for Soybeans)Use Table: Production Function for Soybeans.Assume that the fixed input,capital,is 10 hectares of land and a tractor,which have a combined cost of $150 per day.The cost of labour is $100 per worker per day.The variable cost of producing 25 kilograms of soybeans is:
(Multiple Choice)
4.8/5 (40)
Use the following to answer questions : Table: Cost Data Quantity of Output Variable Cost ( ) Total Cost ( ) 0 0 50 1 50 100 2 70 120 3 100 150 4 140 190 5 190 240 6 250 300 7 320 370
-(Table: Cost Data)Use Table: Cost Data.The average fixed cost of producing four purses is:
(Multiple Choice)
4.8/5 (35)
Use the following to answer question 160: Table: Output and Marginal Cost Output Marginal Cost 1 15 2 10 3 5 4 8 5 12 6 20
-Kaile Cakes produces 10 cakes per day.The marginal cost of the tenth cake is $24,and the average total cost of 10 cakes is $6.The average total cost of nine cakes is:
(Multiple Choice)
4.7/5 (33)
Use the following to answer questions : Table: Cakes Number of mixers Fixed Costs Average Variable Cost 1 \ 1,000 \ 10 2 1,500 7 3 2,500 4
-(Table: Cakes)Use Table: Cakes.Pat is opening a bakery to make and sell special birthday cakes.She is trying to decide how many mixers to purchase.Her estimated fixed and average variable costs if she purchases 1,2,or 3 mixers are shown in the table.Assume that average variable costs do not vary with the quantity of output.If Pat purchases 1 mixer and bakes 400 cakes per day,what is her average fixed cost?
(Multiple Choice)
5.0/5 (41)
In the short run,the average total cost curve reaches its minimum point at a lower level of output than the short-run marginal cost curve reaches its minimum.
(True/False)
4.9/5 (39)
Use the following to answer questions : Table: Costs of Producing Bagels Quantity of Bagels (per period) Total Variable Costs Total Fixed Costs 0 \ 0.00 \ 0.10 1 0.20 0.10 2 0.30 0.10 3 0.35 0.10 4 0.45 0.10 5 0.60 0.10 6 0.80 0.10 7 1.05 0.10 8 1.35 0.10
-(Table: Costs of Producing Bagels)Use Table: Costs of Producing Bagels.Average total cost reaches its minimum value for the _____ bagel.
(Multiple Choice)
4.8/5 (38)
Suppose the marginal cost curve in the short run first decreases and then increases.If marginal cost is increasing,_____ must be _____.
(Multiple Choice)
4.8/5 (44)
Use the following to answer questions : Table: Cakes Number of mixers Fixed Costs Average Variable Cost 1 \ 1,000 \ 10 2 1,500 7 3 2,500 4
-(Table: Cakes)Use Table: Cakes.Pat is opening a bakery to make and sell special birthday cakes.She is trying to decide how many mixers to purchase.Her estimated fixed and average variable costs if she purchases 1,2,or 3 mixers are shown in the table.Assume that average variable costs do not vary with the quantity of output.If Pat purchases 1 mixer,her average total cost _____ in the range of output between 100 and 400 cakes.
(Multiple Choice)
4.8/5 (39)
The long-run average total cost of producing 100 units of output is $4,while the long-run average cost of producing 110 units of output is $4.These numbers suggest that between 100 and 110 units of output,the firm producing this output has:
(Multiple Choice)
4.8/5 (30)
Use the following to answer questions : Table: Production of Bagels Number of Workers Per Period Thousands of Bagels Per Period 0 0 1 5 2 15 3 30 4 42 5 51 6 57 7 60 8 50 9
-(Table: Production of Bagels)Use Table: Production of Bagels.The marginal product of the third worker is _____ bagels.
(Multiple Choice)
4.7/5 (30)
Filters
- Essay(0)
- Multiple Choice(0)
- Short Answer(0)
- True False(0)
- Matching(0)