Exam 21: Graphs in Economics
Exam 1: First Principles198 Questions
Exam 2: Economic Models295 Questions
Exam 3: Supply and Demand264 Questions
Exam 4: Consumer and Producer Surplus228 Questions
Exam 5: Price Controls and Quotas215 Questions
Exam 6: Elasticity88 Questions
Exam 7: Taxes280 Questions
Exam 8: International Trade261 Questions
Exam 9: Decision Making by Individuals and Firms165 Questions
Exam 10: The Rational Consumer197 Questions
Exam 11: Behind the Supply Curve- Inputs and Costs357 Questions
Exam 12: Perfect Competition and the Supply Curve341 Questions
Exam 13: Monopoly316 Questions
Exam 14: Oligopoly272 Questions
Exam 15: Monopolistic Competition246 Questions
Exam 16: Externalities194 Questions
Exam 17: Public Goods and Common Resources180 Questions
Exam 18: The Economics of the Welfare State125 Questions
Exam 19: Factor Markets and the Distribution of Income317 Questions
Exam 20: Uncertainty, risk, and Private Information150 Questions
Exam 21: Graphs in Economics62 Questions
Exam 22: Consumer Preferences153 Questions
Exam 23: Indifference Curve Analysis41 Questions
Select questions type
The relation between two variables that move in the same direction is said to be:
Free
(Multiple Choice)
4.9/5  (27)
(27)
Correct Answer: Verified
C
If two variables are positively related,on a graph they will always be represented by a:
Free
(Multiple Choice)
4.8/5 (33)
Correct Answer:Verified
D
The scaling of the axes of a time-series graph:
Free
(Multiple Choice)
4.8/5 (30)
Correct Answer:Verified
B
Use the following to answer questions : 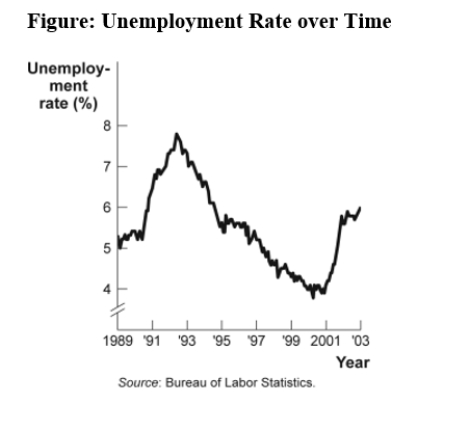 -(Figure: Unemployment Rate over Time)Use Figure: Unemployment Rate over Time.In the time-series graph,as we move from 1997 to 2001,we see that the unemployment rate has _____ from approximately _____% to approximately _____%.
(Multiple Choice)
4.8/5 (44)
Use the following to answer questions : 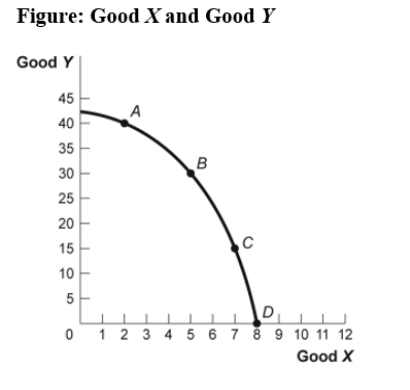 -(Figure: Good X and Good Y)Use Figure: Good X and Good Y.If we move from point B to point C in the figure,the x-variable has _____ units and the y-variable has _____ units.
(Multiple Choice)
4.8/5 (33)
Use the following to answer questions : 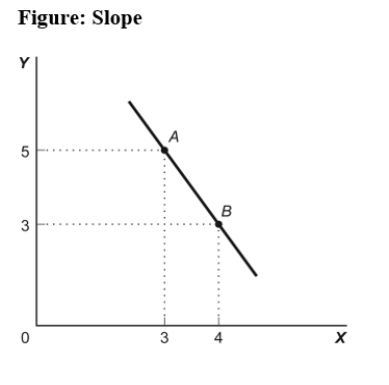 -(Figure: Slope)Use Figure: Slope.The slope of the line in the graph can be calculated by:
(Multiple Choice)
4.8/5 (27)
Use the following to answer questions : 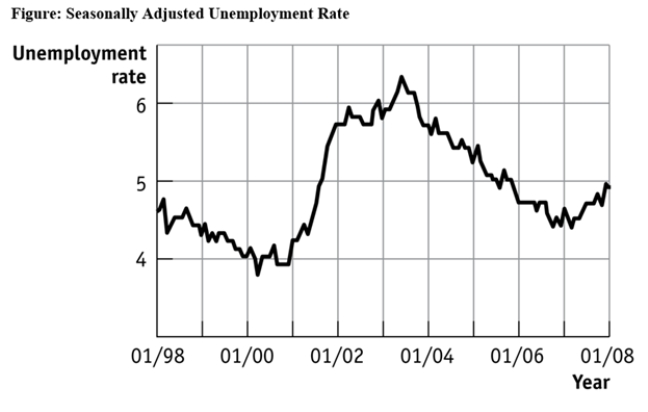 -(Figure: Seasonally Adjusted Unemployment Rate)Use Figure: Seasonally Adjusted Unemployment Rate.The distance between each labeled point on the horizontal axis is 1 year,and the distance between each labeled point on the vertical axis is 1 percentage point of unemployment.What is the approximate slope of the graph between 1/2004 and 1/2006 (using percentage point and years as the units on the vertical and horizontal axes,respectively)?
(Multiple Choice)
4.9/5 (39)
Use the following to answer questions :
-(Figure: Unemployment Rate over Time)Use Figure: Unemployment Rate over Time.In the time-series graph,as we move from 1993 to 1995,we see that the unemployment rate has _____ from approximately _____% to approximately _____%.
(Multiple Choice)
4.8/5 (36)
Use the following to answer questions : 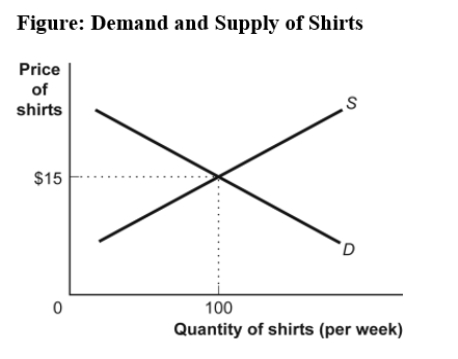 -(Figure: Demand and Supply of Shirts)Use Figure: Demand and Supply of Shirts.In the graph,if the line labeled D shows how many shirts per week will be demanded at various prices,then it is clear that,as the price of shirts falls:
(Multiple Choice)
4.9/5 (38)
The owner of the Dismal Philosopher,one of the five bookstores on University Road,asks you to make a graph showing each College Road bookstore's share of all five stores' book purchases.The BEST way to show this information is with a(n):
(Multiple Choice)
4.7/5 (40)
Use the following to answer questions : Table: Price, Quantity Demanded, and Quantity Supplied Price Quantity demanded 16 8 4 2 1 Quantity supplied 3 5 7 9 11
-(Table: Price,Quantity Demanded,and Quantity Supplied)Use Table: Price,Quantity Demanded,and Quantity Supplied.The slope of the line representing the relation between price on the vertical axis and quantity supplied on the horizontal axis is:
(Multiple Choice)
4.8/5 (34)
Use the following to answer questions :
-(Figure: Good X and Good Y)Use Figure: Good X and Good Y.If we move from point C to point B in the figure,the x-variable has _____ units and the y-variable has _____ units.
(Multiple Choice)
4.8/5 (34)
Use the following to answer question 19: Table: Hours Studied and Quiz Score Hours Studied for Economics Quiz Score on the Economics Quiz (maximum 10 points) 0 2 1 4 2 6 3 8 4 10
-(Table: Hours Studied and Quiz Score)Use Table: Hours Studied and Quiz Score.The table shows data for students in an economics class.If we were to graph these data and draw a line through the points,we would choose _____ to be the independent variable;the vertical intercept of our line would be _____;and the slope of our line would be _____.
(Multiple Choice)
4.8/5 (39)
The _____ of a curve shows the point at which the curve intersects an axis.
(Multiple Choice)
4.8/5 (35)
Use the following to answer questions :
-(Figure: Unemployment Rate over Time)Use Figure: Unemployment Rate over Time.In the time-series graph,as we move from 1991 to 1993,we see that the unemployment rate has _____ from approximately _____% to approximately _____%.
(Multiple Choice)
4.8/5 (30)
Use the following to answer questions :
-(Figure: Slope)Use Figure: Slope.In the graph,the slope of the line between points A and B is:
(Multiple Choice)
4.9/5 (31)
The owner of the Dismal Philosopher,one of the five bookstores on University Road,asks you to make a graph showing each University Road bookstore's share of all five stores' book purchases.A good way to show this information is with a pie chart.
(True/False)
4.9/5 (37)
Filters
- Essay(0)
- Multiple Choice(0)
- Short Answer(0)
- True False(0)
- Matching(0)