Exam 12: Experimental Design and Analysis of Variance
Exam 1: An Introduction to Business Statistics95 Questions
Exam 2: Descriptive Statistics: Tabular and Graphical Methods85 Questions
Exam 3: Descriptive Statistics: Numerical Methods57 Questions
Exam 4: Probability44 Questions
Exam 5: Discrete Random Variables71 Questions
Exam 6: Continuous Random Variables40 Questions
Exam 7: Sampling and Sampling Distributions52 Questions
Exam 8: Confidence Intervals126 Questions
Exam 9: Hypothesis Testing84 Questions
Exam 10: Statistical Inferences for Means and Proportions70 Questions
Exam 11: Statistical Inferences for Population Variances54 Questions
Exam 12: Experimental Design and Analysis of Variance81 Questions
Exam 13: Chi-Square Tests136 Questions
Exam 14: Simple Linear Regression Analysis95 Questions
Exam 15: Multiple Regression and Model Building119 Questions
Exam 16: Time Series Forecasting and Index Numbers71 Questions
Exam 17: Nonparametric Methods61 Questions
Exam 18: Decision Theory85 Questions
Select questions type
When using a chi-square goodness-of-fit test with multinomial probabilities,the rejection of the null hypothesis indicates that at least one of the multinomial probabilities is not equal to the value stated in the null hypothesis.
(True/False)
4.9/5  (37)
(37)
The HR manager of a major office supply chain is interested in determining whether employee educational level affects knowledge of their job.An exam was given to 120 employees.The results are below. 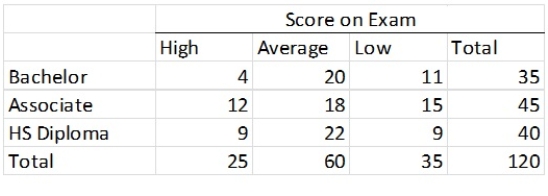 Test the null hypothesis that score is independent of education level at α = .01.
(Essay)
4.8/5 (36)
In performing a chi-square test of independence,as the difference between the respective observed and expected frequencies calculated by assuming independence decreases,the probability of concluding that the row variable is independent of the column variable decreases.
(True/False)
4.8/5 (39)
The HR manager of a major office supply chain is interested in determining whether employee educational level affects knowledge of their job.An exam was given to 120 employees.The results are below.  For each row total,calculate the corresponding percentage.
(Essay)
5.0/5 (35)
While a binomial distribution describes count data that can be classified into one of two mutually exclusive categories,a __________________ distribution describes count data that are classified into more than two mutually exclusive categories.
(Multiple Choice)
4.9/5 (42)
The following frequency table summarizes the ages of 60 shoppers at the local farmer's market. 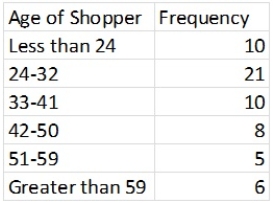 The estimated mean is 36.25,and estimated standard deviation is 13.57.Calculate the probability for each interval,assuming a normal distribution.
(Essay)
4.8/5 (39)
A manufacturing company produces part QV2Y for the aerospace industry.This particular part can be manufactured using 3 different production processes.The management wants to know if the quality of the units of part QV2Y is the same for all three processes.The production supervisor obtained the following data: Process 1 had 29 defective units in 240 items,Process 2 produced 12 defective units in 180 items,and Process 3 manufactured 9 defective units in 150 items.At a significance level of .05,the management wants to perform a hypothesis test to determine whether the quality of items produced appears to be independent of the production process used.What is the rejection point condition?
(Multiple Choice)
4.8/5 (44)
The distance (in thousands of miles)traveled by buses before their first major motor failure is distributed below,with an estimated mean and standard deviation of 95.7 and 38.1.Also shown are the expected frequencies of these intervals if the original population was a normal distribution. 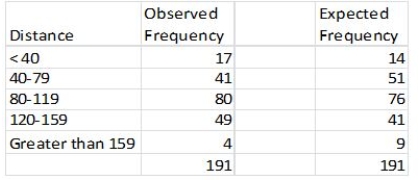 What is the df for testing the hypothesis that the original population is a normal distribution?
(Short Answer)
4.8/5 (43)
In performing a chi-square goodness-of-fit test with multinomial probabilities,the ___________ the difference between observed and expected frequencies,the higher the probability of concluding that the probabilities specified in the null hypothesis are correct.
(Multiple Choice)
4.9/5 (43)
The chi-square goodness-of-fit test will be valid if the average of the expected cell frequencies is ______________.
(Multiple Choice)
4.9/5 (37)
Consider the 3 × 2 contingency table below. 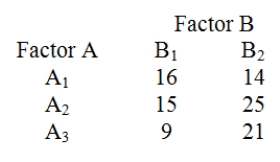 Compute the expected frequencies in row 1.
(Essay)
4.8/5 (36)
Consider the 3 × 2 contingency table below.  Compute the expected frequencies in row 3.
(Essay)
4.9/5 (38)
When we carry out a chi-square test of independence,as the differences between the respective observed and expected frequencies decrease,the probability of concluding that the row variable is independent of the column variable
(Multiple Choice)
4.7/5 (30)
The following frequency table summarizes the ages of 60 shoppers at the local farmer's market 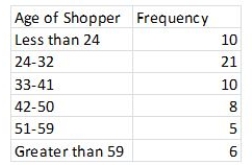 The estimated mean is 36.25,and the estimated standard deviation is 13.57.It is desired to test whether these measurements came from a normal population.What is the df for this chi-square test of normality?
(Short Answer)
4.8/5 (32)
Expected cell frequencies for a multinomial distribution are calculated by assuming statistical dependence.
(True/False)
4.8/5 (35)
A paper presented at a recent meeting of higher education researchers compared the type of college that freshmen attend and the numbers who drop out.A random sample of freshmen shows the following results. 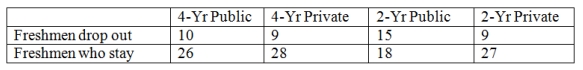 At a significance level of .05,determine the appropriate degrees of freedom and the rejection point condition for this test.
(Essay)
4.8/5 (41)
In performing a chi-square goodness-of-fit test for a normal distribution,if there are 7 intervals,then the number of degrees of freedom for the chi-square statistic is ______.
(Multiple Choice)
4.8/5 (33)
The HR manager of a major office supply chain is interested in determining whether employee educational level affects knowledge of their job.An exam was given to 120 employees.The results are below. 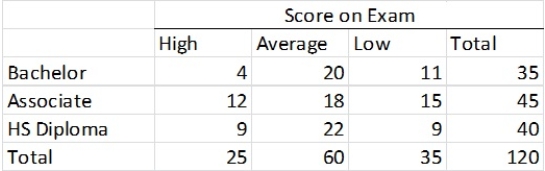 For each column total,calculate the corresponding percentage.
(Essay)
4.8/5 (47)
One use of the chi-square goodness-of-fit test is to determine if specified multinomial probabilities in the null hypothesis are correct.
(True/False)
4.7/5 (25)
A manufacturing company produces part QV2Y for the aerospace industry.This particular part can be manufactured using 3 different production processes.The management wants to know if the quality of the units of part QV2Y is the same for all three processes.The production supervisor obtained the following data: Process 1 had 29 defective units in 240 items,Process 2 produced 12 defective units in 180 items,and Process 3 manufactured 9 defective units in 150 items.Chi-Square Contingency Table Test for Independence 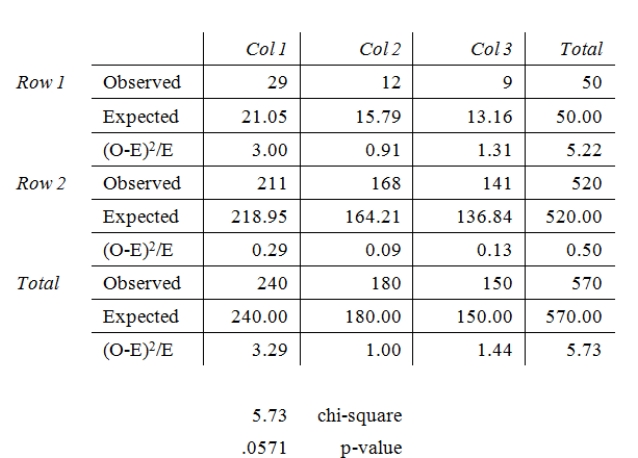 At a significance level of .05,the management wants to perform a hypothesis test to determine if the quality of the items produced appears to be independent of the production process used.Based on the results summarized in the MegaStat/Excel output provided in the table above,we
(Multiple Choice)
4.7/5 (31)
Filters
- Essay(0)
- Multiple Choice(0)
- Short Answer(0)
- True False(0)
- Matching(0)