Exam 2: Observing and Explaining the Economy
Exam 1: The Central Idea154 Questions
Exam 2: Observing and Explaining the Economy107 Questions
Exam 3: The Supply and Demand Model170 Questions
Exam 4: Subtleties of the Supply and Demand Model: Price Floors,price Ceilings,and Elasticity181 Questions
Exam 5: The Demand Curve and the Behavior of Consumers136 Questions
Exam 6: The Supply Curve and the Behavior of Firms182 Questions
Exam 7: The Interaction of People in Markets158 Questions
Exam 8: Costs and the Changes at Firms Over Time172 Questions
Exam 9: The Rise and Fall of Industries139 Questions
Exam 10: Monopoly183 Questions
Exam 11: Product Differentiation, monopolistic Competition, and Oligopoly169 Questions
Exam 12: Antitrust Policy and Regulation152 Questions
Exam 13: Labor Markets179 Questions
Exam 14: Taxes, transfers, and Income Distribution180 Questions
Exam 15: Public Goods, externalities, and Government Behavior198 Questions
Exam 16: Capital and Financial Markets173 Questions
Exam 17: Macroeconomics: the Big Picture152 Questions
Exam 18: Measuring the Production, income, and Spending of Nations160 Questions
Exam 19: The Spending Allocation Model168 Questions
Exam 20: Unemployment and Employment207 Questions
Exam 21: Productivity and Economic Growth158 Questions
Exam 22: Money and Inflation149 Questions
Exam 23: The Nature and Causes of Economic Fluctuations162 Questions
Exam 24: The Economic Fluctuations Model207 Questions
Exam 25: Using the Economic Fluctuations Model177 Questions
Exam 26: Fiscal Policy137 Questions
Exam 27: Monetary Policy168 Questions
Exam 28: Economic Growth and Globalization162 Questions
Exam 29: International Trade248 Questions
Exam 30: International Finance123 Questions
Exam 31: Reading,understanding,and Creating Graphs34 Questions
Exam 32: Consumer Theory With Indifference Curves39 Questions
Exam 33: Producer Theory With Isoquants19 Questions
Exam 34: Present Discounted Value16 Questions
Exam 35: The Miracle of Compound Growth11 Questions
Exam 36:Deriving the Growth Accounting Formula13 Questions
Exam 37: Deriving the Formula for the Keynesian Multiplier and the Forward-Looking Consumption Model28 Questions
Select questions type
A newspaper editorial explaining what should be done to reduce the budget deficit is an example of
(Multiple Choice)
4.8/5  (39)
(39)
Exhibit 2-3 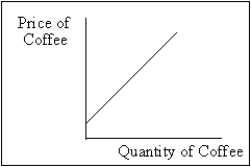 -In Exhibit 2-3,an example of a variable would be the
(Multiple Choice)
4.8/5 (30)
Most disagreements between economists occur because of different data sources.
(True/False)
4.9/5 (35)
All of the following are what economists commonly do except
(Multiple Choice)
4.8/5 (34)
Explaining why the total amount of miles traveled in vehicles have risen in recent years is one example of what economists do.
(True/False)
4.7/5 (35)
In describing the relationship between X and Y,the ceteris paribus assumption implies that
(Multiple Choice)
4.9/5 (34)
Consider an economic model of CD production.Represent this model graphically,algebraically,and verbally. 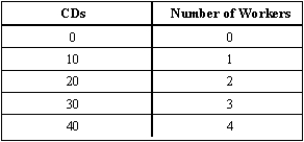
(Essay)
4.9/5 (32)
A microeconomic model must be much smaller in size than a macroeconomic model.
(True/False)
5.0/5 (32)
Knowledge of economics will help you make better decisions about education,employment,and investments.
(True/False)
4.9/5 (26)
The table shows the price of motor fuel (mainly gasoline)and the overall price level (the consumer price index)in five-year intervals over the period 1970 through 1990. 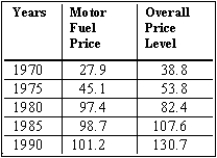 (A)Plot a diagram of the relative price of motor fuel for the 1970-1990 period.
(B)Explain what has been happening to the relative price of motor fuel over this period.
(A)Plot a diagram of the relative price of motor fuel for the 1970-1990 period.
(B)Explain what has been happening to the relative price of motor fuel over this period.
(Essay)
4.8/5 (38)
Exhibit 2-1 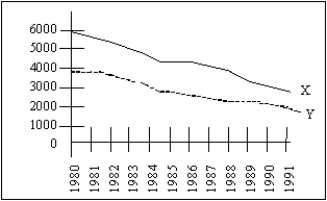 -Exhibit 2-1 shows movements of two variables,X and Y,from 1980 through 1991.From this diagram the most one can conclude is that
(Multiple Choice)
4.8/5 (28)
Economic models differ from those in the physical sciences because
(Multiple Choice)
4.8/5 (41)
Filters
- Essay(0)
- Multiple Choice(0)
- Short Answer(0)
- True False(0)
- Matching(0)