Exam 18: Statistical Quality Control
Exam 1: Introduction to Statistics86 Questions
Exam 2: Charts and Graphs55 Questions
Exam 3: Descriptive Statistics59 Questions
Exam 4: Probability76 Questions
Exam 5: Discrete Distributions81 Questions
Exam 6: Continuous Distributions83 Questions
Exam 7: Sampling and Sampling Distributions87 Questions
Exam 8: Statistical Inference: Estimation for Single Populations82 Questions
Exam 9: Statistical Inference: Hypothesis Testing for Single Populations85 Questions
Exam 10: Statistical Inferences About Two Populations81 Questions
Exam 11: Analysis of Variance and Design of Experiments90 Questions
Exam 12: Simple Regression Analysis and Correlation98 Questions
Exam 13: Multiple Regression Analysis85 Questions
Exam 14: Building Multiple Regression Models78 Questions
Exam 15: Time-Series Forecasting and Index Numbers75 Questions
Exam 16: Analysis of Categorical Data77 Questions
Exam 17: Nonparametric Statistics76 Questions
Exam 18: Statistical Quality Control68 Questions
Exam 19: Decision Analysis79 Questions
Select questions type
Six Sigma is a methodology for quality and does not relate to a measurement value of the process.
(True/False)
4.9/5  (33)
(33)
An  chart is being developed using 15 samples of size 9 each.The average of 15 sample means is 6.20.The average of the 15 ranges is 0.30.The lower control limit is _______________.
(Multiple Choice)
4.9/5 (32)
A scatter diagram is a graphical mechanism for examining the relationship between two variables.
(True/False)
4.7/5 (36)
A recognized brand name product means higher quality to many consumers.Among Garvin's five quality types,this is an example of ___________________.
(Multiple Choice)
4.8/5 (29)
Which of the following quality control chart conditions is an indicator that the process is potentially out-of-control?
(Multiple Choice)
4.9/5 (30)
The term Total Quality Management (TQM)was coined by the well-known quality guru,Edward Deming.
(True/False)
4.8/5 (42)
A plot of the sample ranges over regular time intervals is called a(n)_______.
(Multiple Choice)
4.8/5 (33)
A schematic representation of all the activities and interactions that occur in a process is called a flowchart.
(True/False)
4.7/5 (40)
Sarah Soliz,Director of Quality Programs,is designing  and R charts for the rod shearing process at Stockton Steel.She has 26 samples of rod length,and each sample included measurements of 5 rods.The mean of the 26 sample means is 112 inches,and mean of the 26 ranges is 0.15 inch.The upper control limit for her R chart is ____.
(Multiple Choice)
4.8/5 (37)
According to Garvin,transcendent quality implies that a product __________.
(Multiple Choice)
4.8/5 (34)
Control charts are used to examine the output of a process for disturbing patterns or for data points that indicate that the process is out of control.
(True/False)
4.7/5 (38)
Nels Neugent,Purchasing Manager at Mid-West Medical Center,is designing a p chart to monitor the proportion of defective purchase orders issued at Mid-West.He has the proportions defective for 22 samples of purchase orders.Each sample contains 150 purchase orders,and the average proportion defective is 0.08.The centerline for Nels's p chart is ___________.
(Multiple Choice)
4.9/5 (34)
Sarah Soliz,Director of Quality Programs,is designing  and R charts for the rod shearing process at Stockton Steel.She has 26 samples of rod length,and each sample included measurements of 5 rods.The mean of the 26 sample means is 112 inches,and mean of the 26 ranges is 0.15 inch.The centerline for her
  chart is _________.
(Multiple Choice)
4.9/5 (40)
Jake Flanaghan,Vice President for inpatient pharmacy,at Great Atlantic Medical Center,is designing a c chart to monitor the number of inpatient medication errors that occur each month.The total number of medication errors for January - December last year was 37.The upper control limit for Jake's c chart is ___________.
(Multiple Choice)
4.8/5 (41)
An advantage of a just-in-time inventory system is _________.
(Multiple Choice)
5.0/5 (32)
According to Garvin,product quality is ____________________.
(Multiple Choice)
4.9/5 (45)
Nels Neugent,Purchasing Manager at Mid-West Medical Center,is designing a p chart to monitor the proportion of defective purchase orders issued at Mid-West.He has the proportions defective for 22 samples of purchase orders.Each sample contains 150 purchase orders,and the average proportion defective is 0.08.The upper control limit for Nels's p chart is ___________.
(Multiple Choice)
4.7/5 (29)
According to the following Pareto chart,the most common complaint was ______. 
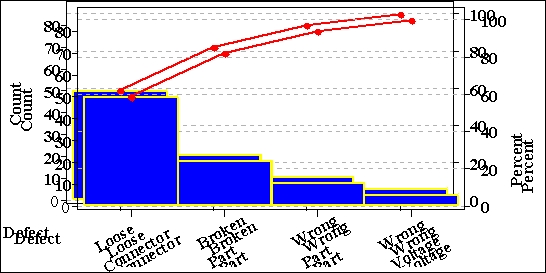
(Multiple Choice)
4.9/5 (39)
You are conducting a study on the blood glucose levels of 9 patients who are on strict diets and exercise routines.To monitor the mean and range of the blood glucose levels of your patients,you take a blood glucose reading every day for each patient for 20 days.The mean of the 9 sample means is 101.03,and the mean of the 9 standard deviations is 29.243.The lower control limit for your  chart is ________.
(Multiple Choice)
4.8/5 (35)
Filters
- Essay(0)
- Multiple Choice(0)
- Short Answer(0)
- True False(0)
- Matching(0)