Exam 6: Two-Way Tables
Exam 1: Getting Started15 Questions
Exam 2: Picturing Distributions With Graphs36 Questions
Exam 3: Describing Distributions With Numbers44 Questions
Exam 4: The Normal Distributions37 Questions
Exam 5: Scatterplots and Correlation34 Questions
Exam 6: Two-Way Tables40 Questions
Exam 7: Producing Data- Sampling44 Questions
Exam 8: Producing Data- Experiments50 Questions
Exam 9: Data Ethics12 Questions
Exam 10: Introducing Probability66 Questions
Exam 11: General Rules of Probability52 Questions
Exam 12: Binomial Distributions39 Questions
Exam 13: Inference for Regression36 Questions
Exam 14: One-Way Analysis of Variance- Comparing Several Means28 Questions
Exam 15: Nonparametric Tests28 Questions
Exam 16: More on Analysis of Variance23 Questions
Select questions type
A sociologist studying freshmen carried out a survey, asking (among other questions) how often students went out per week, how many hours they studied per day, and how many hours they slept at night. The table below provides the answers on the time slept and the time spent studying.  What proportion of students slept at least 6 hours and studied 4 or more hours?
(Multiple Choice)
4.8/5  (31)
(31)
A sociologist studying freshmen carried out a survey, asking (among other questions) how often students went out per week, how many hours they studied per day, and how many hours they slept at night. The table below provides the answers on the time slept and the time spent studying. 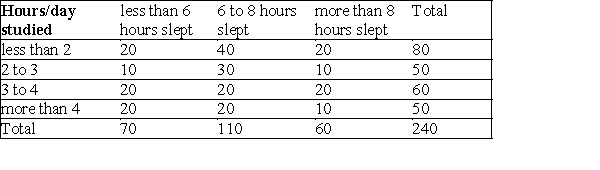 What proportion of students slept less than 6 hours per night?
(Multiple Choice)
4.9/5 (28)
A sociologist studying freshmen carried out a survey, asking (among other questions) how often students went out per week, how many hours they studied per day, and how many hours they slept at night. The table below provides the answers on the time slept and the time spent studying.  Among the students who slept at most 8 hours, what proportion studied at least 3 hours?
(Multiple Choice)
4.8/5 (30)
A sociologist studying freshmen carried out a survey, asking (among other questions) how often students went out per week, how many hours they studied per day, and how many hours they slept at night. The tables below provide the answers on the time slept and the time spent studying by whether or not students went out. 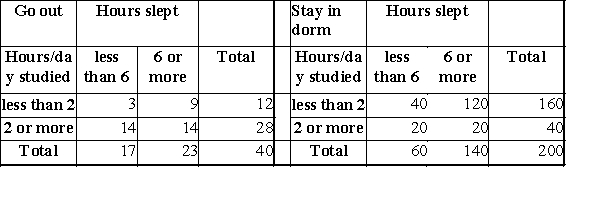 When we examine the data, we find that students who studied more slept less, both among those who go out and among those who stay in the dorm. When we combine both groups of students, we find that those who studied more also slept more. This is an example of:
(Multiple Choice)
4.8/5 (40)
An administrator in charge of residential life services recently conducted a survey of undergraduate college students at a small university. A random sample of 300 students was selected from each class level (freshman, sophomore, junior, or senior). Each student was asked to complete and return a short questionnaire on the quality of campus residences. Some students returned the questionnaire; some did not. This is summarized in the table below.  Which of the following conclusions seems to be supported by the data?
(Multiple Choice)
4.7/5 (39)
A sociologist studying freshmen carried out a survey, asking (among other questions) how often students went out per week, how many hours they studied per day, and how many hours they slept at night. The table below provides the answers on the time slept and the time spent studying. 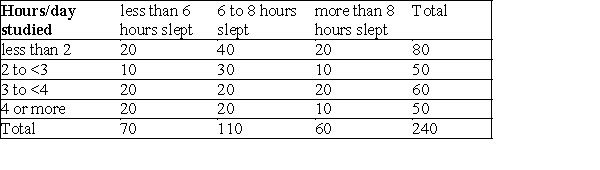 What proportion, among the students who slept more than 8 hours, studied 4 hours or more?
(Multiple Choice)
4.8/5 (35)
A study was conducted on horses to identify factors that might contribute to the formation of enteroliths-stones that form in the colon of the horse and eventually lead to blockage and death. The table below summarizes disease status, cases that have enteroliths by whether a horse has been altered (geldings have been castrated, mares and stallions have not been altered) and by whether the horse gets the majority of its feed as alfalfa. 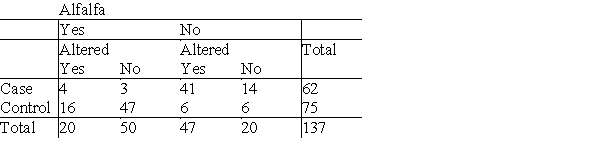 To study whether being fed alfalfa has any effect on the relationship between case status and having been altered, we should:
(Multiple Choice)
4.9/5 (31)
A study was conducted on horses to identify factors that might contribute to the formation of enteroliths-stones that form in the colon of the horse and eventually lead to blockage and death. The table below summarizes disease status by sex (gelding, mare, and stallion). 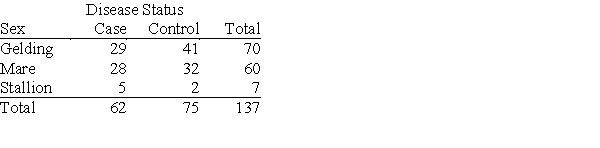 Which of the following statements is not supported by the data?
(Multiple Choice)
4.7/5 (44)
A sociologist studying freshmen carried out a survey, asking (among other questions) how often students went out per week, how many hours they studied per day, and how many hours they slept at night. The tables below provide the answers on the time slept and the time spent studying by whether or not students went out. 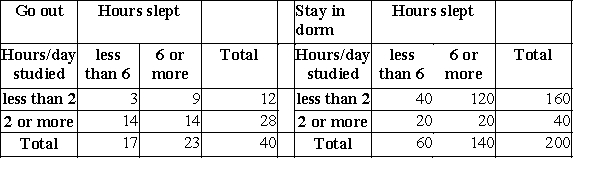 For both groups of students, those who go out and those who stay in the dorm, students who study more:
(Multiple Choice)
4.8/5 (28)
A company exploring ways to help its employees improve work/life balance conducted a survey of 360 of its workers that asked (among other things) about the number of hours typically spent on Facebook each day and about their stress level. 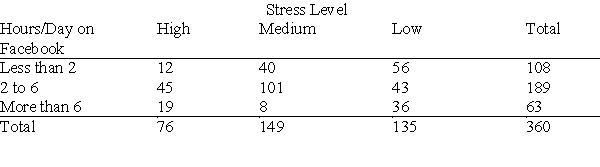 What percent of all employees who responded have a high stress level?
(Multiple Choice)
4.7/5 (38)
The following table describes the opinions of the 570 people who returned a residential life services questionnaire to researchers at a small university. Students were classified by class (freshman, sophomore, junior, or senior) and by their opinion of campus residence quality (high quality, medium quality, or low quality). 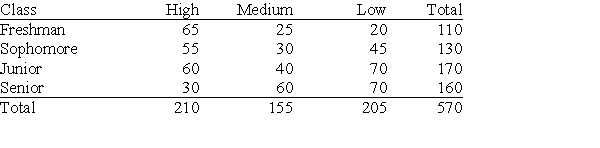 Which marginal or conditional distribution would you use to determine the percent of the students who feel campus residences are of high quality that are seniors?
(Multiple Choice)
4.9/5 (27)
Applicants looking for a job at a restaurant chain may apply to be a server or a kitchen worker. The table below summarizes the number of male and female applicants hired for the jobs for which they applied.  From these data, we may conclude that:
(Multiple Choice)
5.0/5 (27)
A study was conducted on horses to identify factors that might contribute to the formation of enteroliths-stones that form in the colon of the horse and eventually lead to blockage and death. The table below summarizes disease status by sex (gelding, mare, and stallion). 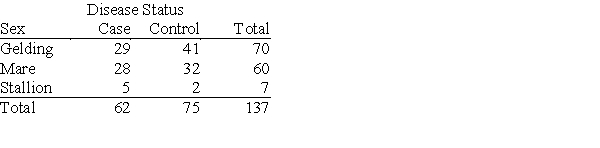 How many conditional distributions for disease status p (being a case, given sex) can be calculated for these data?
(Multiple Choice)
4.9/5 (40)
A study was conducted on horses to identify factors that might contribute to the formation of enteroliths-stones that form in the colon of the horse and eventually lead to blockage and death. The table below summarizes disease status by sex (gelding, mare, and stallion). 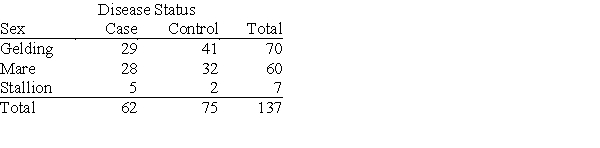 What percent of geldings had enteroliths?
(Multiple Choice)
4.7/5 (33)
An administrator in charge of residential life services recently conducted a survey of undergraduate college students at a small university. A random sample of 300 students was selected from each class level (freshman, sophomore, junior, or senior). Each student was asked to complete and return a short questionnaire on the quality of campus residences. Some students returned the questionnaire; some did not. This is summarized in the table below.  How many different marginal distributions could be plotted from these data?
(Multiple Choice)
4.8/5 (42)
Applicants looking for a job at a restaurant chain may apply to be a server or a kitchen worker. The table below summarizes the number of male and female applicants hired for the jobs for which they applied.  The proportion of all male applicants hired is:
(Multiple Choice)
4.8/5 (29)
An administrator in charge of residential life services recently conducted a survey of undergraduate college students at a small university. A random sample of 300 students was selected from each class level (freshman, sophomore, junior, or senior). Each student was asked to complete and return a short questionnaire on the quality of campus residences. Some students returned the questionnaire; some did not. This is summarized in the table below.  What percent of freshmen returned the questionnaire?
(Multiple Choice)
4.8/5 (32)
Applicants looking for a job at a restaurant chain may apply to be a server or a kitchen worker. The table below summarizes the number of male and female applicants hired for the jobs for which they applied.  The proportion of female hires who are servers is:
(Multiple Choice)
4.9/5 (23)
Since 2000, the median wage in the United States has risen by 1%, while the median wage for every educational subgroup (high school dropouts, high school graduates, college graduates, and people with advanced degrees) has decreased. This apparent contradiction is an example of:
(Multiple Choice)
4.8/5 (39)
An administrator in charge of residential life services recently conducted a survey of undergraduate college students at a small university. A random sample of 300 students was selected from each class level (freshman, sophomore, junior, or senior). Each student was asked to complete and return a short questionnaire on the quality of campus residences. Some students returned the questionnaire; some did not. This is summarized in the table below:  How many different conditional distributions could be plotted from these data?
(Multiple Choice)
4.7/5 (32)
Filters
- Essay(0)
- Multiple Choice(0)
- Short Answer(0)
- True False(0)
- Matching(0)