Exam 14: One-Way Analysis of Variance- Comparing Several Means
Exam 1: Getting Started15 Questions
Exam 2: Picturing Distributions With Graphs36 Questions
Exam 3: Describing Distributions With Numbers44 Questions
Exam 4: The Normal Distributions37 Questions
Exam 5: Scatterplots and Correlation34 Questions
Exam 6: Two-Way Tables40 Questions
Exam 7: Producing Data- Sampling44 Questions
Exam 8: Producing Data- Experiments50 Questions
Exam 9: Data Ethics12 Questions
Exam 10: Introducing Probability66 Questions
Exam 11: General Rules of Probability52 Questions
Exam 12: Binomial Distributions39 Questions
Exam 13: Inference for Regression36 Questions
Exam 14: One-Way Analysis of Variance- Comparing Several Means28 Questions
Exam 15: Nonparametric Tests28 Questions
Exam 16: More on Analysis of Variance23 Questions
Select questions type
Many Americans complain about being sleep deprived. A team of psychologists researched the reasons for this sleep deprivation. After determining that one reason was poor time management, they devised a program to help people manage their time better. They recruited a random sample of 30 people at a major shopping center and randomly split them into three groups of size 10. Group 1 (the controls) received a logbook asking them to record the number of hours slept for a week but nothing else. Group 2 (the informed group) was shown a video to help improve time management. Group 3 (the intervention) participated in a two-day training course on improving time management. Groups 2 and 3 were also asked to keep records for one week on the number of hours slept. The psychologists were interested in learning if providing information or an intervention affects sleep time. After consulting a statistics manual, they decided to use ANOVA for analyzing the data. Which of the following assumptions is required for the validity of this statistical procedure?
Free
(Multiple Choice)
4.9/5  (41)
(41)
Correct Answer: Verified
A
A traffic engineer wanted to study the delays in traffic movement at three traffic signal locations, as measured by the number of seconds before the first car clears the intersection. The engineer selected three locations randomly from all the signals with a similar amount of traffic and number of lanes, and similar turn and signal patterns. The engineer collected the following data on eight randomly chosen days.  The engineer obtains a statistics book and, after investigating, decides that analysis of variance is the appropriate method for his problem. Which of these hypotheses should he be testing to investigate if mean delay times are the same at all locations?
Free
(Multiple Choice)
4.9/5 (40)
Correct Answer:Verified
D
Many Americans complain about being sleep deprived. A team of psychologists researched the reasons for this sleep deprivation. After determining that one reason was poor time management, they devised a program to help people manage their time better. They recruited a random sample of 30 people at a major shopping center and randomly split them into three groups of size 10. Group 1 (the controls) received a logbook asking them to record the number of hours slept for a week but nothing else. Group 2 (the informed group) was shown a video to help improve time management. Group 3 (the intervention) participated in a two-day training course on improving time management. Groups 2 and 3 were also asked to keep records for one week on the number of hours slept. The psychologists were interested in learning if providing information or an intervention affects sleep time. The F-value derived from their data is F = 3.67. Therefore, we can conclude that:
Free
(Multiple Choice)
4.9/5 (32)
Correct Answer:Verified
D
Which of the following is not a condition that must be met for one-way analysis of variance to be valid?
(Multiple Choice)
4.9/5 (30)
Many Americans complain about being sleep deprived. A team of psychologists researched the reasons for this sleep deprivation. After determining that one reason was poor time management, they devised a program to help people manage their time better. They recruited a random sample of 30 people at a major shopping center and randomly split them into three groups of size 10. Group 1 (the controls) received a logbook asking them to record the number of hours slept for a week but nothing else. Group 2 (the informed group) was shown a video to help improve time management. Group 3 (the intervention) participated in a two-day training course on improving time management. Groups 2 and 3 were also asked to keep records for one week on the number of hours slept. The psychologists were interested in learning if providing information or an intervention affects sleep time. The sum of squares groups SSG = 30.494 and the sum of squares error SSE = 112.22. The F statistic value is:
(Multiple Choice)
4.9/5 (38)
Many Americans complain about being sleep deprived. A team of psychologists researched the reasons for this sleep deprivation. After determining that one reason was poor time management, they devised a program to help people manage their time better. They recruited a random sample of 30 people at a major shopping center and randomly split them into three groups of size 10. Group 1 (the controls) received a logbook asking them to record the number of hours slept for a week but nothing else. Group 2 (the informed group) was shown a video to help improve time management. Group 3 (the intervention) participated in a two-day training course on improving time management. Groups 2 and 3 were also asked to keep records for one week on the number of hours slept. The psychologists were interested in learning if providing information or an intervention affects sleep time. The null hypothesis the psychologists wished to test-where C = mean sleep time for the control group, IG = mean sleep time for the information group, and IV = mean sleep time for the intervention group-is given by:
(Multiple Choice)
4.9/5 (30)
A company conducted an experiment to investigate the effects of three different processes on the strength of its steel. The investigators randomly divided the production of 120 batches of steel, using 40 batches for each process. The steel was rated on a scale of 0 to 100 for its strength. The following sample means and standard deviations were obtained.  The degrees of freedom for the F test are:
(Multiple Choice)
4.9/5 (32)
A traffic engineer wanted to study the delays in traffic movement at three traffic signal locations, as measured by the number of seconds before the first car clears the intersection. The engineer selected three locations randomly from all the signals with a similar amount of traffic and number of lanes, and similar turn and signal patterns. The engineer collected the following data on eight randomly chosen days. 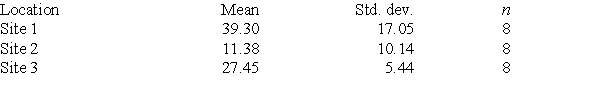 The engineer obtains a statistics book and, after investigating, decides that analysis of variance is the appropriate method for his problem. What conditions have to hold for analysis of variance to be valid?
(Multiple Choice)
4.9/5 (32)
Many Americans complain about being sleep deprived. A team of psychologists researched the reasons for this sleep deprivation. After determining that one reason was poor time management, they devised a program to help people manage their time better. They recruited a random sample of 30 people at a major shopping center and randomly split them into three groups of size 10. Group 1 (the controls) received a logbook asking them to record the number of hours slept for a week but nothing else. Group 2 (the informed group) was shown a video to help improve time management. Group 3 (the intervention) participated in a two-2 day training course on improving time management. Groups 2 and 3 were also asked to keep records for one week on the number of hours slept. The psychologists were interested in learning if providing information or an intervention affects sleep time. They are going to test H0: C = IG = IV versus the alternative:
(Multiple Choice)
4.8/5 (28)
The test statistic F used in one-way analysis of variance is:
(Multiple Choice)
4.8/5 (28)
At what age do babies learn to crawl? Does it depend on the time of year that babies were born? Data were collected from parents who brought their babies into the University of Denver's Infant Study Center to participate in one of a number of experiments between 1988 and 1991. Parents reported the birth month and the age at which their child was first able to creep or crawl a distance of four feet within one minute. The resulting data were grouped by month of birth: January, May, and September. Crawling age is given in weeks. Assume that the data can be considered as three independent random samples (one from each of the populations composed of babies born in that particular month) and that the populations of crawling ages have Normal distributions.  An ANOVA F test was run on the data. The following shows a portion of the results.
  The mean square for groups is:
(Multiple Choice)
4.8/5 (29)
The alternative hypothesis for the one-way analysis of variance states that:
(Multiple Choice)
4.9/5 (32)
A company conducted an experiment to investigate the effects of three different processes on the strength of its steel. The investigators randomly divided the production of 120 batches of steel, using 40 batches for each process. The steel was rated on a scale of 0 to 100 for its strength. The following sample means and standard deviations were obtained. 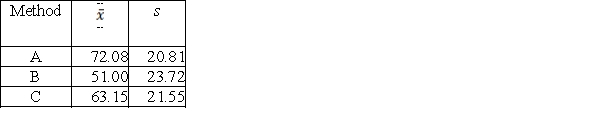 The sum of squares for groups for this experiment is given by 8952, and the sum of squares error is given by 56946. The F test is:
(Multiple Choice)
4.9/5 (32)
At what age do babies learn to crawl? Does it depend on the time of year that babies were born? Data were collected from parents who brought their babies into the University of Denver's Infant Study Center to participate in one of a number of experiments between 1988 and 1991. Parents reported the birth month and the age at which their child was first able to creep or crawl a distance of four feet within one minute. The resulting data were grouped by month of birth: January, May, and September. Crawling age is given in weeks. Assume that the data can be considered as three independent random samples (one from each of the populations composed of babies born in that particular month) and that the populations of crawling ages have Normal distributions. 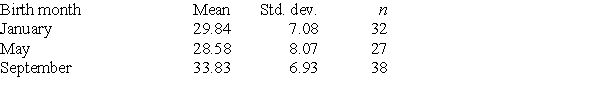 An ANOVA F test was run on the data. The following shows a portion of the results.
 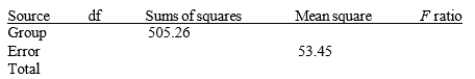 The alternative hypothesis for the ANOVA F test is:
(Multiple Choice)
4.9/5 (36)
Investigators gave caffeine to fruit flies to see if it affected their rest. The four treatments were a control, a low caffeine dose of 1 mg/ml of blood, a medium dose of 3 mg/ml of blood, and a higher caffeine dose of 5 mg/ml of blood. Twelve fruit flies were assigned at random to the four treatments, three to each treatment, and the minutes of rest measured over a 24-hour period were recorded. Assume the data that follow are four independent SRSs (one from each of the four populations of caffeine levels) and that the distribution of the yields is Normal. 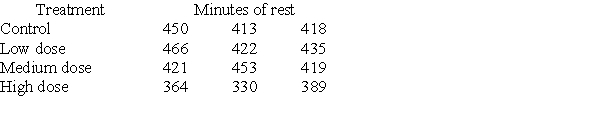 A partial ANOVA table produced by Minitab follows, along with the means and standard deviation of the yields for the four groups.
  For this example, we notice that:
(Multiple Choice)
4.9/5 (25)
Many Americans complain about being sleep deprived. A team of psychologists researched the reasons for this sleep deprivation. After determining that one reason was poor time management, they devised a program to help people manage their time better. They recruited a random sample of 30 people at a major shopping center and randomly split them into three groups of size 10. Group 1 (the controls) received a logbook asking them to record the number of hours slept for a week, but nothing else. Group 2 (the informed group) was shown a video to help improve time management. Group 3 (the intervention) participated in a two-day training course on improving time management. Groups 2 and 3 were also asked to keep records for one week on the number of hours slept. The psychologists were interested in learning if providing information or an intervention affects sleep time. The analysis of this type of study is called:
(Multiple Choice)
4.9/5 (33)
Investigators gave caffeine to fruit flies to see if it affected their rest. The four treatments were a control, a low caffeine dose of 1 mg/ml of blood, a medium dose of 3 mg/ml of blood, and a higher caffeine dose of 5 mg/ml of blood. Twelve fruit flies were assigned at random to the four treatments, three to each treatment, and the minutes of rest measured over a 24-hour period were recorded. Assume the data that follow are four independent SRSs (one from each of the four populations of caffeine levels) and that the distribution of the yields is Normal.  A partial ANOVA table produced by Minitab follows, along with the means and standard deviation of the yields for the four groups.
 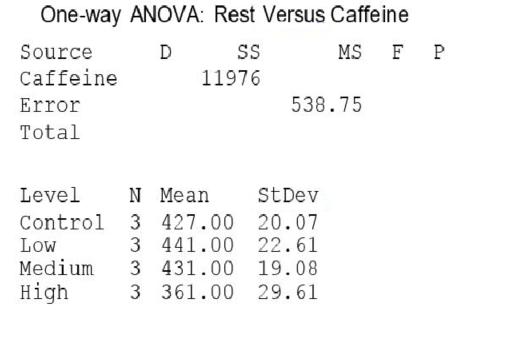 The null hypothesis for the ANOVA F test is that:
(Multiple Choice)
4.7/5 (37)
At what age do babies learn to crawl? Does it depend on the time of the year that babies were born? Data were collected from parents who brought their babies into the University of Denver's Infant Study Center to participate in one of a number of experiments between 1988 and 1991. Parents reported the birth month and the age at which their child was first able to creep or crawl a distance of four feet within one minute. The resulting data were grouped by month of birth: January, May, and September. Crawling age is given in weeks. Assume that the data can be considered as three independent random samples (one from each of the populations composed of babies born in that particular month) and that the populations of crawling ages have Normal distributions.  An ANOVA F test was run on the data. The following shows a portion of the results.
  The value of the ANOVA F statistic is:
(Multiple Choice)
4.9/5 (23)
A traffic engineer wanted to study the delays in traffic movement at three traffic signal locations, as measured by the number of seconds before the first car clears the intersection. The engineer selected three locations randomly from all the signals with a similar amount of traffic and number of lanes, and similar turn and signal patterns. The engineer collected the following data on eight randomly chosen days.  The engineer obtains a statistics book and, after investigating, decides that analysis of variance is the appropriate method for his problem. Using technology, the engineer obtains a P-value = 0.001. This tells the engineer that:
(Multiple Choice)
4.9/5 (34)
A company runs a three-day workshop on strategies for working effectively in teams. On each day, a different strategy is presented. Forty-eight employees of the company attend the workshop. At the outset, all 48 are divided into 12 teams of four. The teams remain the same for the entire workshop. Strategies are presented in the morning. In the afternoon, the teams are presented with a series of small tasks. The number of these tasks completed successfully, using the strategy taught that morning, is recorded for each team. The mean number of tasks completed successfully by all teams each day and the standard deviation are computed. The results follow. 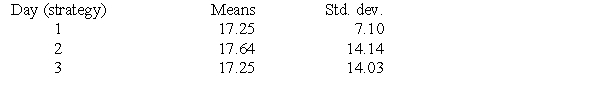 The researchers did an ANOVA F test of the data and obtained the following results.
 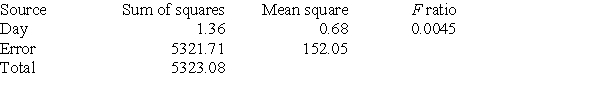 In this example, we notice that:
(Multiple Choice)
4.8/5 (38)
Filters
- Essay(0)
- Multiple Choice(0)
- Short Answer(0)
- True False(0)
- Matching(0)