Exam 5: Scatterplots and Correlation
Exam 1: Getting Started15 Questions
Exam 2: Picturing Distributions With Graphs36 Questions
Exam 3: Describing Distributions With Numbers44 Questions
Exam 4: The Normal Distributions37 Questions
Exam 5: Scatterplots and Correlation34 Questions
Exam 6: Two-Way Tables40 Questions
Exam 7: Producing Data- Sampling44 Questions
Exam 8: Producing Data- Experiments50 Questions
Exam 9: Data Ethics12 Questions
Exam 10: Introducing Probability66 Questions
Exam 11: General Rules of Probability52 Questions
Exam 12: Binomial Distributions39 Questions
Exam 13: Inference for Regression36 Questions
Exam 14: One-Way Analysis of Variance- Comparing Several Means28 Questions
Exam 15: Nonparametric Tests28 Questions
Exam 16: More on Analysis of Variance23 Questions
Select questions type
Which of the following statements is correct?
Free
(Multiple Choice)
4.8/5  (30)
(30)
Correct Answer: Verified
A
What can be said of the correlation between the brand of an automobile and its quality?
Free
(Multiple Choice)
4.8/5 (37)
Correct Answer:Verified
D
A scatterplot can be used to illustrate the relationship between:
Free
(Multiple Choice)
4.7/5 (35)
Correct Answer:Verified
C
An economist conducted a study of the possible association between weekly income and weekly grocery expenditures. The particular interest was whether higher income would cause shoppers to spend more on groceries. A random sample of shoppers at a local supermarket was obtained. A questionnaire was administered asking about the weekly income of each shopper's family and their grocery bill for that week. The gender of each shopper was also obtained. The data below are expenditures and income for 10 selected survey participants. 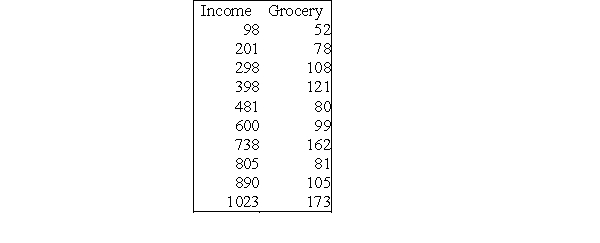 The correlation for these data is given by:
(Multiple Choice)
4.8/5 (34)
An economist conducted a study of the possible association between weekly income and weekly grocery expenditures. Of particular interest was whether higher income would result in shoppers spending more on groceries. A random sample of shoppers at a local supermarket was obtained. A questionnaire was administered asking about the weekly income of each shopper's family and their grocery bill for that week. A graphical display of the relationship between grocery expenditure and income might be:
(Multiple Choice)
4.9/5 (30)
A student wonders if people with similar heights tend to date each other. She measures herself, her dormitory roommate, and the women in the adjoining rooms; then she measures the next man each woman dates. Here are the pairs of data (heights in inches):  Which of the following statements is true?
(Multiple Choice)
4.9/5 (37)
An economist conducted a study of the possible association between weekly income and weekly grocery expenditures. The particular interest was whether higher income would cause shoppers to spend more on groceries. A random sample of shoppers at a local supermarket was obtained. A questionnaire was administered asking about the weekly income of each shopper's family and their grocery bill for that week. The data below are for 10 selected survey participants: 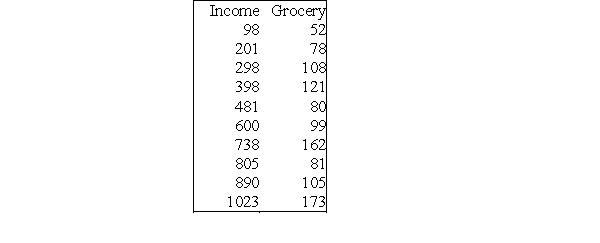 The scatterplot with a linear trend line is given below:
 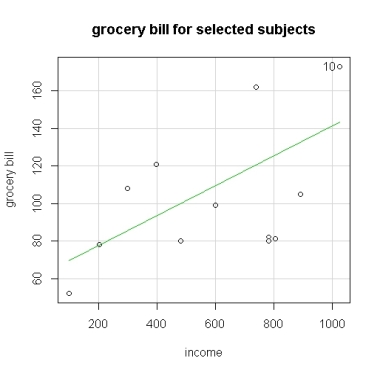 If the expenditure for subject 7 is decreased and for subject 8 is increased, the effect on the correlation:
(Multiple Choice)
4.8/5 (33)
An economist conducted a study of the possible association between weekly income and weekly grocery expenditures. The particular interest was whether higher income would cause shoppers to spend more on groceries. A random sample of shoppers at a local supermarket was obtained. A questionnaire was administered asking about the weekly income of each shopper's family and their grocery bill for that week. The gender of each shopper was also obtained. The relationship between grocery expenditure and income was assessed by calculating both a correlation for the females only and a correlation for the males only. For the females, r = 0.45 and for the males, r = 0.38. We conclude that:
(Multiple Choice)
4.9/5 (28)
A scatterplot of the amount of alcohol consumed according to a food diary (DR) against the amount of alcohol consumed on a frequent food questionnaire (FFQ):
(Multiple Choice)
4.7/5 (39)
The graph below shows a scatterplot of midterm scores plotted against homework scores. The graph contains several points that correspond to unusually low homework scores, and one of those scores is associated with the highest midterm score. 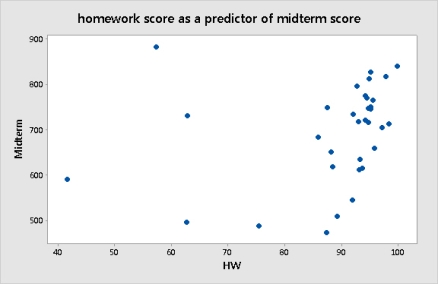 Removing this point will:
(Multiple Choice)
4.8/5 (38)
An economist conducted a study of the possible association between weekly income and weekly grocery expenditures. Of particular interest was whether higher income would result in shoppers to spending more on groceries. A random sample of shoppers at a local supermarket was obtained. A questionnaire was administered asking about the weekly income of each shopper's family and their grocery bill for that week. The explanatory variable is:
(Multiple Choice)
4.8/5 (28)
A researcher measures the correlation between two variables. This correlation tells us:
(Multiple Choice)
4.8/5 (34)
Consider the following scatterplot, which depicts the tread depth (measured in mils, where 1 mil = 0.001 inch) versus the number of miles driven on the tire (measured in thousands of miles). 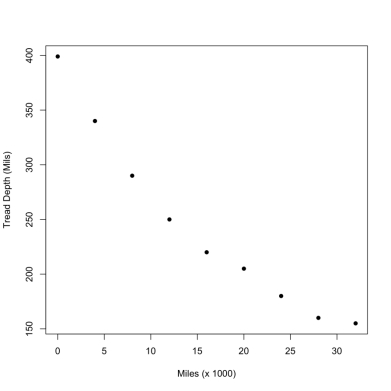 The correlation between x and y:
(Multiple Choice)
4.9/5 (43)
Archaeologists often find only parts of ancient human remains. For example, they may find a small finger bone, called the metacarpal bone. Is it possible to predict the height of a human from the length of a metacarpal bone? To investigate, a researcher measures the heights and metacarpal lengths of 200 adults. In making the scatterplot, the researcher should:
(Multiple Choice)
4.8/5 (38)
For each menu item at a fast food restaurant, the fat content (in grams) and the number of calories were recorded. A scatterplot of these data is given: 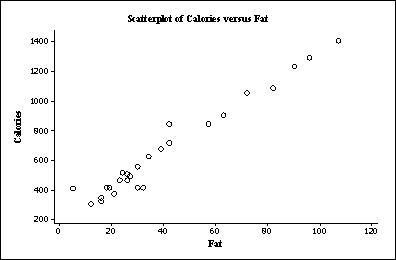 A plausible value for the correlation between fat content and number of calories is:
(Multiple Choice)
4.7/5 (28)
Colleges often rely heavily on raising money for an "annual fund" to support operations. Alumni are typically solicited for donations to the annual fund. Studies suggest that the graduate's annual income is a good predictor of the amount of money he or she would be willing to donate, and there is a reasonably strong, positive, linear relationship between these variables. In the studies described:
(Multiple Choice)
4.8/5 (37)
An introductory statistics class decides to investigate whether there is a relationship between the performance on midterms 1 and 2. The instructor creates a scatterplot of midterm 2 scores (y) versus midterm 1 scores (x). 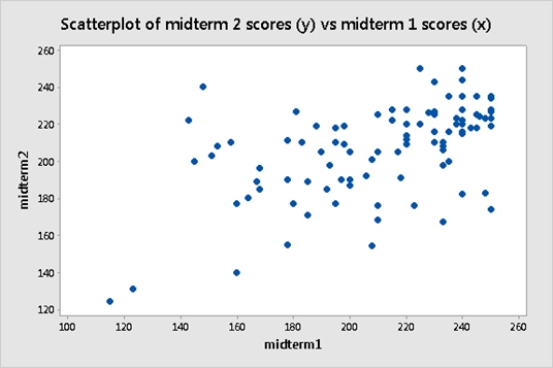 Based on the plot, which of the following is likely true?
(Multiple Choice)
4.7/5 (42)
An economist conducted a study of the possible association between weekly income and weekly grocery expenditures. Of particular interest was whether higher income would result in shoppers spending more on groceries. A random sample of shoppers at a local supermarket was obtained. A questionnaire was administered asking about the weekly income of each shopper's family and their grocery bill for that week. The gender of each shopper was also obtained. One question of interest was whether spending patterns differed much by gender. 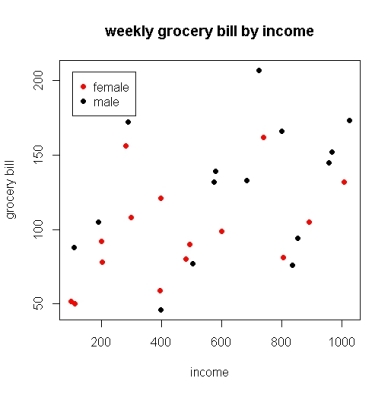 The scatterplot above shows red dots for females and black dots for males. Based on this plot:
(Multiple Choice)
4.9/5 (39)
The volume of oxygen consumed (in liters per minute) while a person is at rest and while a person is exercising (running on a treadmill) were both measured for 50 subjects. The goal is to determine if the volume of oxygen consumed during aerobic exercise can be estimated from the amount consumed at rest. The results are plotted below. 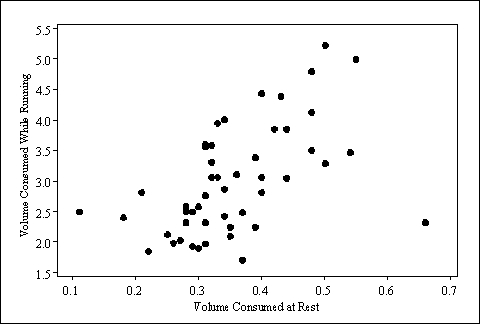 If the outlier is removed, the correlation coefficient r will:
(Multiple Choice)
4.9/5 (40)
A researcher states that bone density in women is negatively associated with age. This means that:
(Multiple Choice)
4.7/5 (29)
Filters
- Essay(0)
- Multiple Choice(0)
- Short Answer(0)
- True False(0)
- Matching(0)