Exam 5: Scatterplots and Correlation
Exam 1: Getting Started15 Questions
Exam 2: Picturing Distributions With Graphs36 Questions
Exam 3: Describing Distributions With Numbers44 Questions
Exam 4: The Normal Distributions37 Questions
Exam 5: Scatterplots and Correlation34 Questions
Exam 6: Two-Way Tables40 Questions
Exam 7: Producing Data- Sampling44 Questions
Exam 8: Producing Data- Experiments50 Questions
Exam 9: Data Ethics12 Questions
Exam 10: Introducing Probability66 Questions
Exam 11: General Rules of Probability52 Questions
Exam 12: Binomial Distributions39 Questions
Exam 13: Inference for Regression36 Questions
Exam 14: One-Way Analysis of Variance- Comparing Several Means28 Questions
Exam 15: Nonparametric Tests28 Questions
Exam 16: More on Analysis of Variance23 Questions
Select questions type
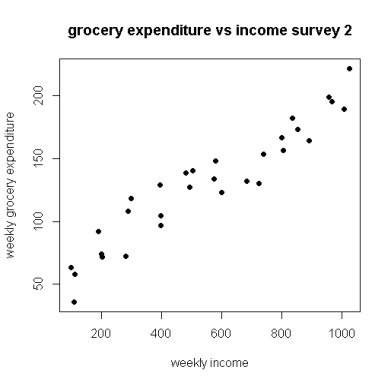
An economist conducted a study of the possible association between weekly income and weekly grocery expenditures. The particular interest was whether higher income would cause shoppers to spend more on groceries. A random sample of shoppers at a local supermarket was obtained. A questionnaire was administered asking about the weekly income of each shopper's family and their grocery bill for that week. A second survey was conducted at a different supermarket, and the scatterplot was obtained for the relationship between grocery expenditures and incomes in that survey as well. The two scatterplots are given below: 
 Which of the following statements is true?
(Multiple Choice)
4.9/5  (39)
(39)
An economist conducted a study of the possible association between weekly income and weekly grocery expenditures. Of particular interest was whether higher income would result in shoppers spending more on groceries. A random sample of shoppers at a local supermarket was obtained. A questionnaire was administered asking about the weekly income of each shopper's family and their grocery bill for that week. The response variable is:
(Multiple Choice)
4.8/5 (37)
Below is a scatterplot of the number of home runs versus the number of stolen bases for major league teams in 2009. American League teams are represented by filled circles, and National League teams are represented by open circles. 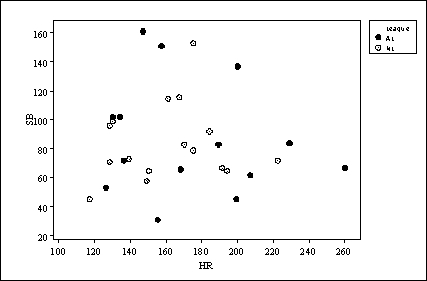 We conclude that:
(Multiple Choice)
4.7/5 (41)
Does exposure to classical music (through instrument lessons or concert attendance) improve a child's scholastic performance? In a study, researchers measured the amount of exposure to classical music for a group of children, along with their scores on the state's academic proficiency exam. The explanatory variable in this study is:
(Multiple Choice)
4.8/5 (32)
The volume of oxygen consumed (in liters per minute) while a person is at rest and while a person is exercising (running on a treadmill) were both measured for 50 subjects. The goal is to determine if the volume of oxygen consumed during aerobic exercise can be estimated from the amount consumed at rest. The results are plotted below.  The scatterplot suggests that there is:
(Multiple Choice)
4.8/5 (35)
An economist conducted a study of the possible association between weekly income and weekly grocery expenditures. Of particular interest was whether higher income would result in shoppers spending more on groceries. A random sample of shoppers at a local supermarket was obtained. A questionnaire was administered asking about the weekly income of each shopper's family and their grocery bill for that week.  The scatterplot of weekly grocery expenditures vs. income shows:
(Multiple Choice)
4.8/5 (39)
Frequent food questionnaires (FFQ) are a simple way to obtain information on the foods individuals consume by asking them questions about typical amounts of food consumed in a day, a week, or a month. A more accurate picture is obtained by obtaining a detailed food diary (DR) for several days that are randomly chosen over a certain time period. The data obtained from a frequent food questionnaire can be compared with the food diary to assess the validity of the questionnaire. The correlation between alcohol consumption from the food questionnaire and diary was r = 0.89, based on seven individuals: 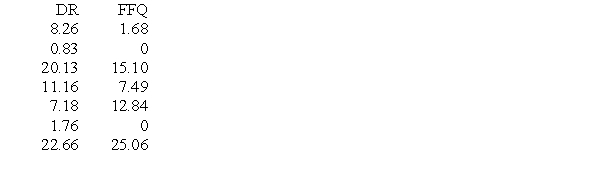 Based on the seven individuals for whom data are available, which of the following statements is incorrect?
(Multiple Choice)
4.8/5 (35)
The volume of oxygen consumed (in liters per minute) while a person is at rest and while a person is exercising (running on a treadmill) were both measured for 50 subjects. The goal is to determine if the volume of oxygen consumed during aerobic exercise can be estimated from the amount consumed at rest. The results are plotted below. 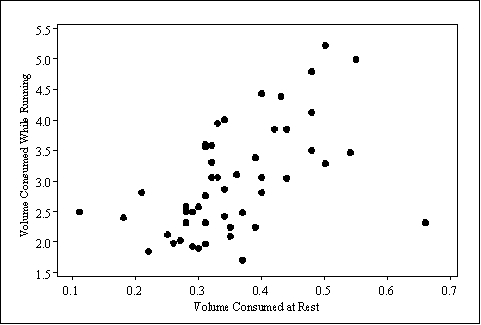 In this study, the explanatory variable is:
(Multiple Choice)
4.9/5 (29)
Consider the following scatterplot of two variables x and y. 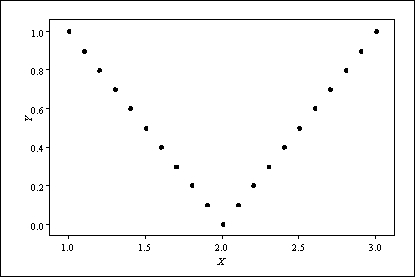 We may conclude:
(Multiple Choice)
4.9/5 (36)
When water flows across farmland, some soil is washed away, resulting in erosion. An experiment was conducted to investigate the effect of the rate of water flow (liters per second) on the amount of soil (kilograms) washed away. The data are given in the following table: 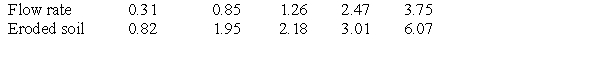 The association between flow rate and the amount of eroded soil is:
(Multiple Choice)
4.7/5 (33)
Are higher than average sea surface temperatures associated with a greater than average number of hurricanes each year? In a 2010 study, the average global sea surface temperature anomaly was recorded, along with the number of Atlantic hurricanes above or below the average for that year. The response variable is:
(Multiple Choice)
4.9/5 (35)
A group of students participated in an experiment to study the association between resting heart rate and exercise heart rate under various exercise conditions. Study participants stepped at a frequency of 14 steps per minute (0), 21 steps per minute (1), and 28 steps per minute (2). To investigate the relationship between resting and exercise heart rate, and to see the effects of step frequency on the relationship, a scatterplot might be created by:
(Multiple Choice)
4.9/5 (31)
For each menu item at a fast food restaurant, the fat content (in grams) and the number of calories were recorded. A scatterplot of these data is given: 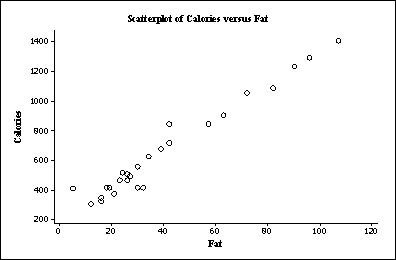 The restaurant decides to add six new high-calorie, low-fat pasta dishes to its menu. What is a plausible value for the new correlation coefficient describing the relationship between fat and calories?
(Multiple Choice)
4.9/5 (29)
Filters
- Essay(0)
- Multiple Choice(0)
- Short Answer(0)
- True False(0)
- Matching(0)