Exam 16: The Influence of Monetary and Fiscal Policy on Aggregate Demand
Exam 1: Ten Principles of Economics347 Questions
Exam 2: Thinking Like an Economist528 Questions
Exam 3: Interdependence and the Gains From Trade413 Questions
Exam 4: The Market Forces of Supply and Demand568 Questions
Exam 5: Measuring a Nations Income428 Questions
Exam 6: Measuring the Cost of Living420 Questions
Exam 7: Production and Growth417 Questions
Exam 8: Saving, Investment, and the Financial System473 Questions
Exam 9: The Basic Tools of Finance419 Questions
Exam 10: Unemployment562 Questions
Exam 11: The Monetary System421 Questions
Exam 12: Money Growth and Inflation384 Questions
Exam 13: Open-Economy Macroeconomic Models447 Questions
Exam 14: A Macroeconomic Theory of the Open Economy375 Questions
Exam 15: Aggregate Demand and Aggregate Supply466 Questions
Exam 16: The Influence of Monetary and Fiscal Policy on Aggregate Demand416 Questions
Exam 17: The Short-Run Trade-Off Between Inflation and Unemployment367 Questions
Exam 18: Six Debates Over Macroeconomic Policy235 Questions
Select questions type
Figure 16-2. On the left-hand graph, MS represents the supply of money and MD represents the demand for money; on the right-hand graph, AD represents aggregate demand. The usual quantities are measured along the axes of both graphs.
 -Refer to Figure 16-2. Assume the money market is always in equilibrium, and suppose r1 = 0.08; r2 = 0.12; Y1 = 13,000; Y2 = 10,000; P1 = 1.0; and P2 = 1.2. Which of the following statements is correct?
(Multiple Choice)
4.8/5  (30)
(30)
Suppose the multiplier has a value that exceeds 1, and there are no crowding out or investment accelerator effects. Which of the following would shift aggregate demand to the right by more than the increase in expenditures?
(Multiple Choice)
4.8/5 (36)
Figure 16-2. On the left-hand graph, MS represents the supply of money and MD represents the demand for money; on the right-hand graph, AD represents aggregate demand. The usual quantities are measured along the axes of both graphs.
-Refer to Figure 16-2. Assume the money market is always in equilibrium. Under the assumptions of the model,
(Multiple Choice)
4.8/5 (35)
Which of the following policy actions shifts the aggregate-demand curve?
(Multiple Choice)
4.8/5 (38)
For the U.S. economy, which of the following helps explain the slope of the aggregate-demand curve?
(Multiple Choice)
5.0/5 (39)
Figure 16-2. On the left-hand graph, MS represents the supply of money and MD represents the demand for money; on the right-hand graph, AD represents aggregate demand. The usual quantities are measured along the axes of both graphs.
-Refer to Figure 16-2. Assume the money market is always in equilibrium. Under the assumptions of the model,
(Multiple Choice)
4.9/5 (41)
According to liquidity preference theory, the money-supply curve would shift rightward
(Multiple Choice)
4.7/5 (36)
According to a 2009 article in The Economist, the multiplier effect and crowding-out effect would exactly offset each other when the economy is
(Multiple Choice)
4.8/5 (32)
According to liquidity preference theory, if the quantity of money demanded is greater than the quantity supplied, then the interest rate will
(Multiple Choice)
4.9/5 (40)
A significant lag for monetary policy is the time it takes to for a change in the money supply to change the economy. A significant lag for fiscal policy is the time it takes to pass legislation authorizing it.
(True/False)
4.8/5 (34)
Suppose an economy's marginal propensity to consume (MPC) is 0.6. Then
(Multiple Choice)
4.9/5 (38)
Figure 16-4. On the figure, MS represents money supply and MD represents money demand.
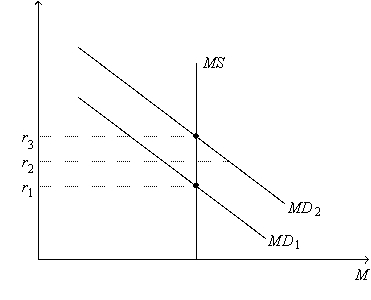 -Refer to Figure 16-4. Suppose the current equilibrium interest rate is r1. Which of the following events would cause the equilibrium interest rate to increase?
(Multiple Choice)
4.7/5 (33)
If the MPC is 0.75 and there are no crowding-out or accelerator effects, then an initial increase in aggregate demand of $100 billion will eventually shift the aggregate demand curve to the right by
(Multiple Choice)
4.8/5 (37)
Figure 16-6. On the left-hand graph, MS represents the supply of money and MD represents the demand for money; on the right-hand graph, AD represents aggregate demand. The usual quantities are measured along the axes of both graphs.
 -Refer to Figure 16-6. Suppose the multiplier is 5 and the government increases its purchases by $10 billion. Also, suppose the AD curve would shift from AD1 to AD2 if there were no crowding out; the AD curve actually shifts from AD1 to AD3 with crowding out. Also, suppose the horizontal distance between the curves AD1 and AD3 is $20 billion. The extent of crowding out, for any particular level of the price level, is
(Multiple Choice)
4.9/5 (37)
Supply-side economists focus more than other economists on
(Multiple Choice)
4.8/5 (42)
Filters
- Essay(0)
- Multiple Choice(0)
- Short Answer(0)
- True False(0)
- Matching(0)