Exam 16: The Influence of Monetary and Fiscal Policy on Aggregate Demand
Exam 1: Ten Principles of Economics347 Questions
Exam 2: Thinking Like an Economist528 Questions
Exam 3: Interdependence and the Gains From Trade413 Questions
Exam 4: The Market Forces of Supply and Demand568 Questions
Exam 5: Measuring a Nations Income428 Questions
Exam 6: Measuring the Cost of Living420 Questions
Exam 7: Production and Growth417 Questions
Exam 8: Saving, Investment, and the Financial System473 Questions
Exam 9: The Basic Tools of Finance419 Questions
Exam 10: Unemployment562 Questions
Exam 11: The Monetary System421 Questions
Exam 12: Money Growth and Inflation384 Questions
Exam 13: Open-Economy Macroeconomic Models447 Questions
Exam 14: A Macroeconomic Theory of the Open Economy375 Questions
Exam 15: Aggregate Demand and Aggregate Supply466 Questions
Exam 16: The Influence of Monetary and Fiscal Policy on Aggregate Demand416 Questions
Exam 17: The Short-Run Trade-Off Between Inflation and Unemployment367 Questions
Exam 18: Six Debates Over Macroeconomic Policy235 Questions
Select questions type
Figure 16-2. On the left-hand graph, MS represents the supply of money and MD represents the demand for money; on the right-hand graph, AD represents aggregate demand. The usual quantities are measured along the axes of both graphs.
 -Refer to Figure 16-2. What does Y represent on the horizontal axis of the right-hand graph?
(Multiple Choice)
4.9/5  (35)
(35)
According to liquidity preference theory, investment spending would rise if the price level
(Multiple Choice)
4.9/5 (41)
The change in aggregate demand that results from fiscal expansion changing the interest rate is called the
(Multiple Choice)
4.8/5 (44)
Charisse is of the opinion that the interest rate depends on the economy's saving propensities and investment opportunities. Most economists would say that Charisse's opinion is
(Multiple Choice)
4.8/5 (48)
In the early 1960s, the Kennedy administration made considerable use of
(Multiple Choice)
4.9/5 (40)
During the economic downturn of 2008-2009, the Federal Reserve
(Multiple Choice)
4.9/5 (33)
Figure 16-2. On the left-hand graph, MS represents the supply of money and MD represents the demand for money; on the right-hand graph, AD represents aggregate demand. The usual quantities are measured along the axes of both graphs.
-Refer to Figure 16-2. Which of the following quantities is held constant as we move from one point to another on either graph?
(Multiple Choice)
4.8/5 (42)
Scenario 16-1. Take the following information as given for a small, imaginary economy:
 -Refer to Scenario 16-1. The marginal propensity to consume for this economy is
(Multiple Choice)
4.8/5 (37)
Figure 16-4. On the figure, MS represents money supply and MD represents money demand.
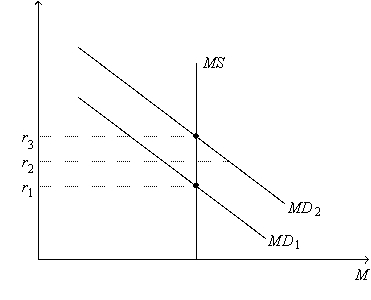 -Refer to Figure 16-4. Suppose the money-demand curve is currently MD2. If the current interest rate is r2, then
(Multiple Choice)
4.8/5 (39)
According to liquidity preference theory, the money-supply curve is
(Multiple Choice)
4.8/5 (30)
Which of the following policy alternatives would be an appropriate response to a sharp increase in investment spending, assuming policymakers want to stabilize output?
(Multiple Choice)
4.9/5 (37)
During periods of expansion, automatic stabilizers cause government expenditures
(Multiple Choice)
4.8/5 (31)
An increase in government spending on goods to build or repair infrastructure
(Multiple Choice)
4.9/5 (30)
Figure 16-4. On the figure, MS represents money supply and MD represents money demand.
-Refer to Figure 16-4. Suppose the money-demand curve is currently MD1. If the current interest rate is r2, then
(Multiple Choice)
4.8/5 (42)
Figure 16-2. On the left-hand graph, MS represents the supply of money and MD represents the demand for money; on the right-hand graph, AD represents aggregate demand. The usual quantities are measured along the axes of both graphs.
-Refer to Figure 16-2. A decrease in Y from Y1 to Y2 is explained as follows:
(Multiple Choice)
4.7/5 (36)
There is an increase in government expenditures financed by taxes and its overall short-run effect on output is larger than the change in government spending. Which of the following is correct?
(Multiple Choice)
4.8/5 (34)
Filters
- Essay(0)
- Multiple Choice(0)
- Short Answer(0)
- True False(0)
- Matching(0)