Exam 16: The Influence of Monetary and Fiscal Policy on Aggregate Demand
Exam 1: Ten Principles of Economics347 Questions
Exam 2: Thinking Like an Economist528 Questions
Exam 3: Interdependence and the Gains From Trade413 Questions
Exam 4: The Market Forces of Supply and Demand568 Questions
Exam 5: Measuring a Nations Income428 Questions
Exam 6: Measuring the Cost of Living420 Questions
Exam 7: Production and Growth417 Questions
Exam 8: Saving, Investment, and the Financial System473 Questions
Exam 9: The Basic Tools of Finance419 Questions
Exam 10: Unemployment562 Questions
Exam 11: The Monetary System421 Questions
Exam 12: Money Growth and Inflation384 Questions
Exam 13: Open-Economy Macroeconomic Models447 Questions
Exam 14: A Macroeconomic Theory of the Open Economy375 Questions
Exam 15: Aggregate Demand and Aggregate Supply466 Questions
Exam 16: The Influence of Monetary and Fiscal Policy on Aggregate Demand416 Questions
Exam 17: The Short-Run Trade-Off Between Inflation and Unemployment367 Questions
Exam 18: Six Debates Over Macroeconomic Policy235 Questions
Select questions type
The main criticism of those who doubt the ability of the government to respond in a useful way to the business cycle is that the theory by which money and government expenditures change output is flawed.
(True/False)
4.8/5  (33)
(33)
If the Federal Reserve increases the money supply, then initially people want to
(Multiple Choice)
4.8/5 (40)
If the marginal propensity to consume is 5/6, and there is no investment accelerator or crowding out, a $20 billion increase in government expenditures would shift the aggregate demand curve right by
(Multiple Choice)
4.9/5 (42)
When the government reduces taxes, which of the following decreases?
(Multiple Choice)
4.8/5 (27)
A 2009 article in The Economist noted that some studies have provided evidence indicating that multipliers are
(Multiple Choice)
4.9/5 (36)
Figure 16-6. On the left-hand graph, MS represents the supply of money and MD represents the demand for money; on the right-hand graph, AD represents aggregate demand. The usual quantities are measured along the axes of both graphs.
 -Refer to Figure 16-6. Suppose the multiplier is 3 and the government increases its purchases by $25 billion. Also, suppose the AD curve would shift from AD1 to AD2 if there were no crowding out; the AD curve actually shifts from AD1 to AD3 with crowding out. Finally, assume the horizontal distance between the curves AD1 and AD3 is $30 billion. The extent of crowding out, for any particular level of the price level, is
(Multiple Choice)
5.0/5 (39)
Figure 16-3.
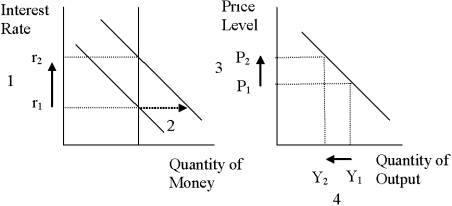 -Refer to Figure 16-3. What quantity is represented by the vertical line on the left-hand graph?
(Multiple Choice)
4.8/5 (36)
An essential piece of the liquidity preference theory is the demand for money.
(True/False)
4.8/5 (33)
For the U.S. economy, the most important reason for the downward slope of the aggregate-demand curve is the interest-rate effect.
(True/False)
4.7/5 (34)
According to liquidity preference theory, if there were a shortage of money, then
(Multiple Choice)
4.9/5 (40)
Initially, the economy is in long-run equilibrium. The aggregate demand curve then shifts $80 billion to the left. The government wants to change spending to offset this decrease in demand. The MPC is 0.75. Suppose the effect on aggregate demand of a tax change is 3/4 as strong as the effect of a change in government expenditure. There is no crowding out and no accelerator effect. What should the government do if it wants to offset the decrease in real GDP?
(Multiple Choice)
4.9/5 (33)
According to liquidity preference theory, the money-supply curve would shift if the Fed
(Multiple Choice)
4.9/5 (38)
Filters
- Essay(0)
- Multiple Choice(0)
- Short Answer(0)
- True False(0)
- Matching(0)