Exam 16: The Influence of Monetary and Fiscal Policy on Aggregate Demand
Exam 1: Ten Principles of Economics439 Questions
Exam 2: Thinking Like an Economist615 Questions
Exam 3: Interdependence and the Gains From Trade527 Questions
Exam 4: The Market Forces of Supply and Demand697 Questions
Exam 5: Measuring a Nations Income518 Questions
Exam 6: Measuring the Cost of Living543 Questions
Exam 7: Production and Growth507 Questions
Exam 8: Saving, Investment, and the Financial System565 Questions
Exam 9: The Basic Tools of Finance510 Questions
Exam 10: Unemployment and Its Natural Rate698 Questions
Exam 11: The Monetary System517 Questions
Exam 12: Money Growth and Inflation484 Questions
Exam 13: Open-Economy Macroeconomics: Basic Concepts520 Questions
Exam 14: A Macroeconomic Theory of the Open Economy478 Questions
Exam 15: Aggregate Demand and Aggregate Supply563 Questions
Exam 16: The Influence of Monetary and Fiscal Policy on Aggregate Demand510 Questions
Exam 17: The Short-Run Tradeoff Between Inflation and Unemployment516 Questions
Exam 18: Six Debates Over Macroeconomic Policy372 Questions
Select questions type
A fiscal stimulus was initiated by President Obama in response to the economic downturn of 2008-2009. At that time, the president's economists estimated the multiplier to be
(Multiple Choice)
4.9/5  (28)
(28)
Suppose the MPC is 0.60. Assume there are no crowding out or investment accelerator effects. If the government increases expenditures by $200 billion, then by how much does aggregate demand shift to the right? If the government decreases taxes by $200 billion, then by how much does aggregate demand shift to the right?
(Multiple Choice)
4.8/5 (47)
The Kennedy tax cut of 1964 included an investment tax credit that was designed to
(Multiple Choice)
4.9/5 (27)
Figure 34-2. On the left-hand graph, MS represents the supply of money and MD represents the demand for money; on the right-hand graph, AD represents aggregate demand. The usual quantities are measured along the axes of both graphs.
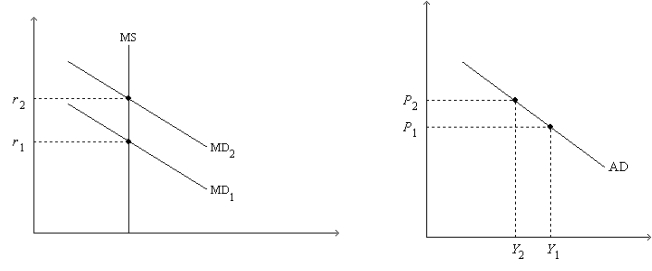 -Refer to Figure 34-2. What does Y represent on the horizontal axis of the right-hand graph?
(Multiple Choice)
4.8/5 (35)
Other things the same, which of the following happens if the price level rises?
(Multiple Choice)
4.9/5 (33)
If a $1,000 increase in income leads to an $800 increase in consumption expenditures, then the marginal propensity to consume is
(Multiple Choice)
4.9/5 (38)
Imagine that the government increases its spending by $75 billion. Which of the following by itself would tend to make the change in aggregate demand different from $75 billion?
(Multiple Choice)
4.7/5 (35)
According to the theory of liquidity preference, money demand
(Multiple Choice)
4.9/5 (41)
Suppose there are both multiplier and crowding out effects but without any accelerator effects. An increase in government expenditures would definitely
(Multiple Choice)
4.8/5 (30)
Suppose there were a large decline in net exports. If the Fed wanted to stabilize output, it could
(Multiple Choice)
4.8/5 (33)
Figure 34-3 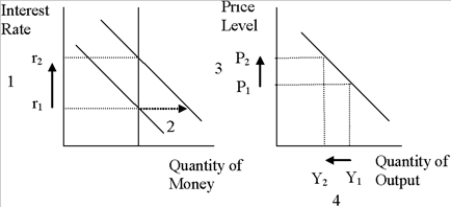 -Refer to Figure 34-3. What quantity is represented by the downward-sloping line on the left-hand graph?
(Multiple Choice)
4.8/5 (38)
Suppose the MPC is 0.9. There are no crowding out or investment accelerator effects. If the government increases its expenditures by $30 billion, then by how much does aggregate demand shift to the right? If the government decreases taxes by $30 billion, then by how far does aggregate demand shift to the right?
(Multiple Choice)
4.8/5 (41)
Suppose an increase in interest rates causes rising unemployment and falling output. To counter this, the Federal Reserve would
(Multiple Choice)
5.0/5 (34)
A surplus or shortage in the money market is eliminated by adjustments in the price level according to
(Multiple Choice)
4.8/5 (33)
One of President Obama's first policy initiatives was a stimulus bill that included large increases in government spending.
(True/False)
5.0/5 (37)
Filters
- Essay(0)
- Multiple Choice(0)
- Short Answer(0)
- True False(0)
- Matching(0)